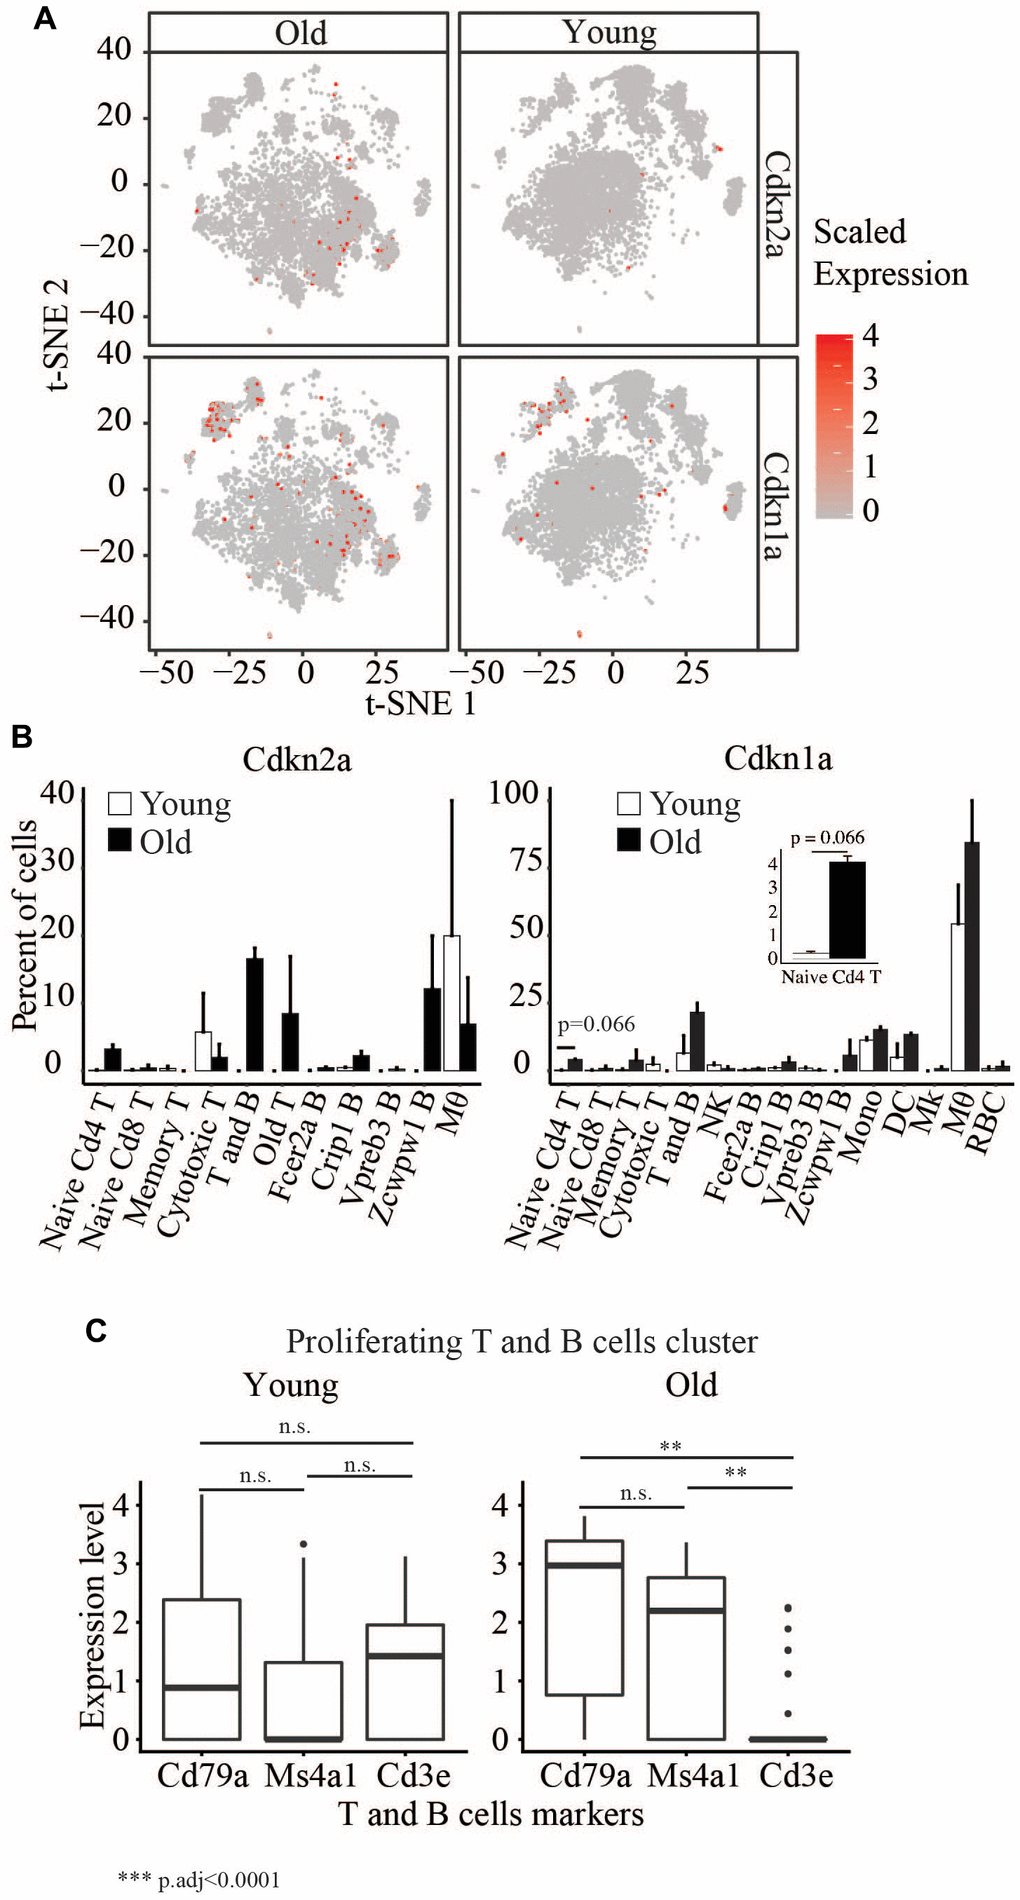
Figure 5.(A) t-SNE visualization of cells with different Cdkn2a and Cdkn1a expression levels in young and old. (B) Barplots showing the percent of cells in young and old expression Cdkn2a and Cdkn1a. (C) Boxplots showing the expression levels of Cd79a, Ms4a1 and Cd3e in the proliferating T and B cells cluster.