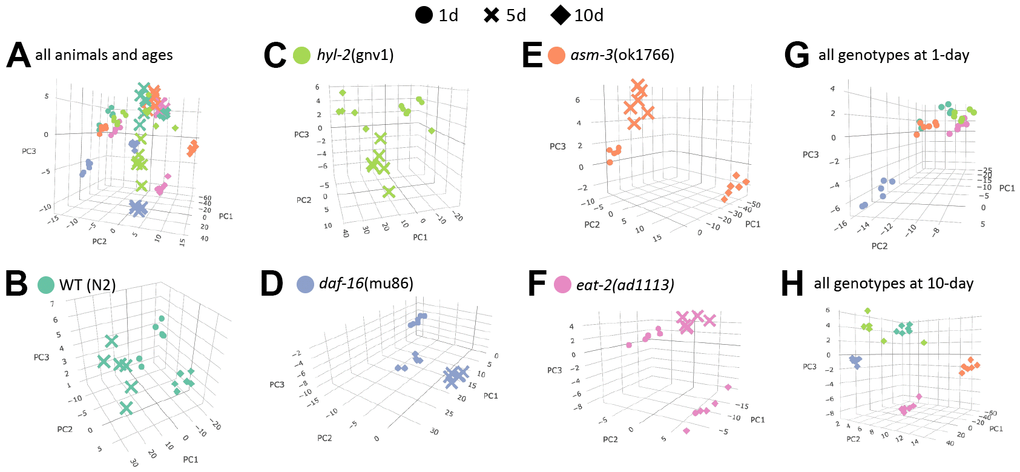
Figure 2.Age is a major determinant of lipid profiles in C. elegans. Principal component analysis (PCA) graphs show lipid profiles by 1-day (circles), 5-day (cross bars), and 10-day (diamonds). (A) PCA graph showing variation all groups, by strain and age. (B–F) PCA graphs showing variations in age by strain (different colors as indicated). (G–H) PCA graphs showing variations by 1-day old animals (G) and 10-day old animals (H).