


Introduction
Lipidomic analysis is an emerging field for investigating lifespan regulation and age-related diseases. Lipidomic profiles can be determinants of lifespan and disease conditions [1, 2]. For example, lipid classes including fatty acids (FA), triacylglycerols (TAG), sphingolipids (SL), and phospholipids (PL) have been identified as targets in lipid signatures related to aging [2, 3]. Furthermore, specific signatures are detected in the lipid profiles of those with age-related diseases, such as Alzheimer’s Disease [4–9]. In addition, the abundance of many fatty acid subtypes differs between the youth, elderly, and centenarians [10, 11].
Lipids serve diverse functions and occur in varied locations within cells. The lipid composition of cell membranes can affect aging processes through regulating protein localization, peroxidation, and cell structure. Intracellular lipids, on the other hand, can be involved in signaling, be sources of energy storage, and affect trafficking and organelle functions related to stress responses [12, 13]. For example, the degree of saturation of membrane fatty acids and the levels of polyunsaturated fatty acids (PUFAs) may mediate oxidative damage associated with aging cells [2]. Lipid analyses using model organisms have correlated longevity to elevated PUFAs, as these long carbon chains are more susceptible to oxidative damage [2, 14]. Furthermore, breakdown of lipid droplets that store TAG through lipophagy may release specific fatty acids that mediate the transcriptional regulation of genes involved in stress response and longevity [13, 15, 16]. While TAG levels determine cellular energy storage, total TAGs may have both beneficial and detrimental roles depending on the type of lipid and the organism [17, 18].
Sphingolipid changes are observed in lipidomic profiles associated with age, making it an interesting biomarker for aging [19]; in particular, sphingomyelin (SM) abundance is associated with lifespan in several organisms, including C. elegans [20–23]. For example, mutants lacking acid sphingomyelinase (asm-3) have longer lifespans [24]. Interestingly, ASM-3 may interact with the DAF-2/insulin-like growth factor receptor, possibly by regulating receptor localization, as loss of asm-3 increased the nuclear localization of the DAF-16/FOXO transcription factor that is normally inhibited by DAF-2 [24, 25]. Indeed, further evidence supports that sphingolipids make up a major component of microdomains in cell membranes and may mediate protein localization, including receptor localization [26–28]. Interestingly, specific sphingolipid metabolism enzymes, including sphingomyelinase and ceramidase, may have increased activity during aging in rats [29]. However, it is not clear how changes in sphingolipid metabolic enzymes may impact other sphingolipids and larger lipidomic changes.
Many of the metabolic enzymes that mediate lipid synthesis or breakdown have been linked to stress response and aging in organisms [1]. For example, several genes involved with fatty acid elongation (Elovl5), desaturation (Scd5), and mitochondrial fatty acid synthesis (Mecr and Oxsm) have been identified as targets of natural selection related to increased lifespan in mammals [30]. In C. elegans, fatty acid elongation also seems important for aging [1, 31]. For example, knockdown of elo-2, a fatty acid elongase, results in increased lifespan, while knockdown of elo-5 decreases lifespan. In addition, genetic studies targeting sphingolipid metabolism suggest that specific enzymes may mediate lifespan in worms and flies, and chronological and replicative lifespan in yeast [25, 32–34].
Studies identifying new regulators of aging are critical, given the global rise in an aging population. Lipidomic studies serve as a powerful approach to identify specific metabolic pathways that may contribute to organismal longevity, healthy aging, or pathology. Indeed, lipidomic approaches in long-lived humans and model organisms have provided insight into the lipid changes associated with healthy aging [1, 17, 35]. In particular, work using C. elegans have identified age related changes in specific lipids, lipid classes, as well as the ratio of monosaturated to polysaturated fatty acids (MUFA:PUFA ratio) [36, 37]. Here, we examine the lipidomes of animals lacking the sphingolipid metabolism enzymes, asm-3/acid sphingomyelinase or hyl-2/ceramide synthase, which have previously been shown to have extended and reduced lifespans, respectively, in C. elegans [24, 34, 38]. Understanding enzymatic regulation of sphingolipid metabolism is valuable, as changes to sphingomyelins and ceramides impact cell membranes, cell death signaling, and aging [39]. Using asm-3 and hyl-2 mutants, we find that each has a unique lipidome compared to wild type, and each shares a similar lipid profile with other short and long-lived C. elegans models of aging, respectively. These findings add to our understanding of lipid changes associated with aging.
Results
Altering ceramide metabolism affects oxidative stress responses and lipid abundance
Previous work has shown that C. elegans with abnormal ceramide metabolism have altered lifespans and stress response. For example, genetic manipulations leading to the loss of hyl-2/CER synthase - which makes ceramide (Figure 1A) - result in shortened lifespans, hypersensitivity to anoxia, and poor survival to heat stress [34, 38, 40]. On the other hand, genetic and pharmacological manipulations that inhibit asm-3/acid sphingomyelinase - which converts sphingomyelin to ceramide - increase lifespan [24, 25]. Here, we explored the age-related response of hyl-2 and asm-3 mutants to oxidative stress induced by juglone (JG). We found that hyl-2 mutants at both young and old ages are more sensitive to oxidative stress compared to wildtype (N2) animals. Specifically, survival of hyl-2 animals exposed to 150μM juglone decreased significantly from wildtype animals at 1 and 10 days of age (Kaplan-Meier estimate and log rank test; p=8.5e-11 and p=0.01455 respectively), while asm-3 mutants did not differ from wildtype animals at either age (p>0.05 for both; Figure 1B). hyl-2 mutants showed a similar response to paraquat (PQ) (Supplementary Figure 1).
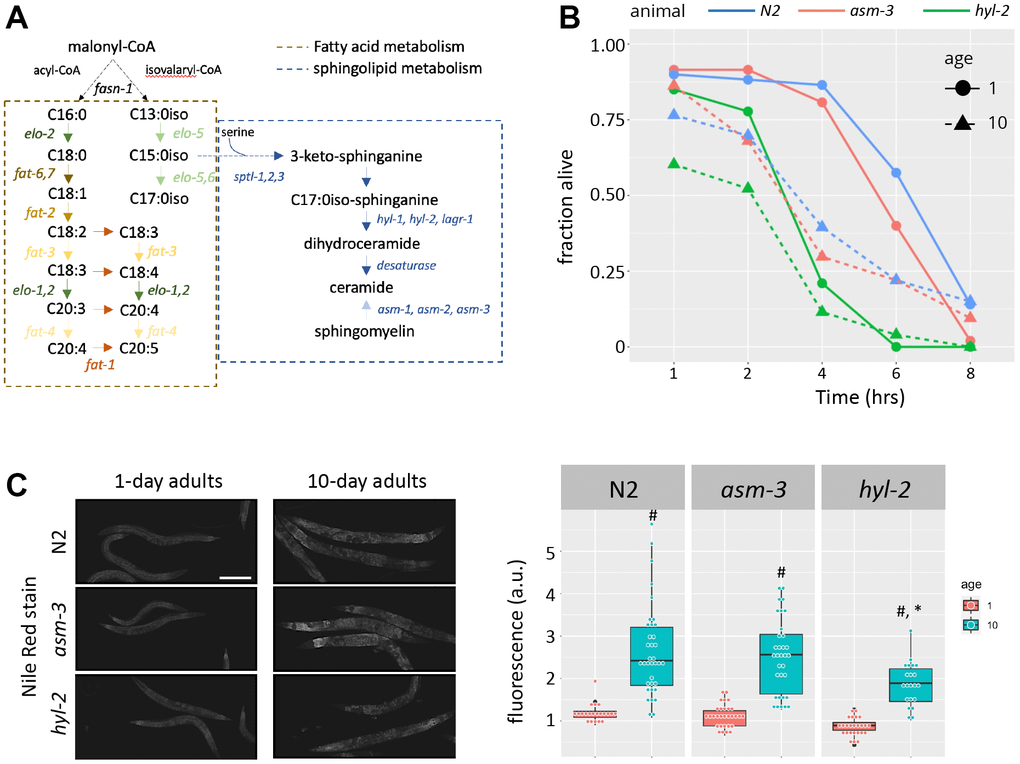
Figure 1. Loss of hyl-2/CER synthase results in poor oxidative stress responses. (A) Diagram showing the lipid pathways and metabolic enzymes producing free fatty acids (FFAs) and sphingolipids (SLs). (B) Survival of 1-, 5-, and 10-day old N2 (blue), asm-3 (red), and hyl-2 (green) worms treated with 150μM juglone. Worms were treated with juglone in 96 well plates, and survival was determined by a movement response to agitation. Survival curves were analyzed using Kaplan-Meier estimate and pairwise differences were determined using log-rank tests (n=49 for N2 1 day; n=48 for N2 10 day; n=46 for asm-3 1 day; n=35 for asm-3 10 day; n=28 for hyl-2 1 day; n=44 for hyl-2 10 day). (C) Representative images (left) and fluorescence quantification (right) of Nile Red lipid staining in 1-day and 10-day old N2, asm-3, and hyl-2 animals. #indicates p<0.05 compared to 1-day counterpart of the same genotype and *indicates p<0.05 compared to N2 counterpart of the same age.
Given the links between lipid profiles and aging, we next tested whether loss of hyl-2 or asm-3 altered lipid abundance using Nile red, a stain primarily for neutral lipids such as triglycerides, and may particularly label lysosomal related organelles [41, 42]. We found that 10-day old animals had greater Nile red staining compared to their 1-day counterparts (p<0.001 for all genotypes). Comparing across genotypes showed that 10-day hyl-2 mutants had significantly less Nile red staining than N2 animals (p=9.8e-4) but not at the 1-day timepoint (p=0.61); contrary, asm-3 animals were not statistically different from N2 on either day. These findings suggest that manipulations in ceramide metabolism may produce broad lipid changes in older animals.
Lipidomes of hyl-2 and asm-3 mutants show differential lipid changes
To explore specific lipid changes in asm-3 and hyl-2 mutants, we used a lipidomics approach to evaluate changes in specific lipid molecules and classes of lipids. Using shotgun lipidomics by electrospray ionization (ESI) and mass spectrometry, we sampled six independent replicates of 1-, 5-, and 10-day old adult worms of different genotypes. We profiled N2, asm-3, and hyl-2 animals as well as two well-studied mutant models of aging (the short-lived daf-16/FOXO mutant and the long-lived, calorically restricted eat-2/mAChR mutant). Overall, 701 lipids were identified and analyzed covering phosphatidylcholines (PC), phosphatidylethanolamines (PE), lysophosphatidylcholines (LPC), lysophosphatidylethanolamine (LPE), sphingomyelins (SM), cholesterol esters (CE), ceramides (CER), free fatty acids (FFA), diacylglycerols (DAG), and triacylglycerols (TAG). We detected significant differences in class composition between the different strains and age groups compared to 1-day old N2 adults (Supplementary Figure 2). Interestingly, TAG increased in 10-day old animals compared to 1-day old animals in N2, daf-16, and hyl-2 animals. However, this increase was not observed in long-lived eat-2 or asm-3 animals. Overall, we found that our samples had 12.1% FFA, 26.1% TAG, 2.0% DAG, 35.0% PEs, and 16.0% PCs, which is somewhat comparable to that observed in yolk (16.2%, 26.4%, 3.2%, 28.2% and 23%, reference [43]). However, lipid composition is likely to vary by technique and tissue preparation [44].
To visualize how age affects lipidome changes, we first examined how well lipidomes clustered by age or genotype using principal components analysis (PCA). For this analysis, raw concentrations of each lipid were log2 transformed and analyzed. We found that within each genotype, animals from each age group clustered most closely with animals from the same age group (Figure 2A–2F). This suggests that age is a major driver of lipid profiles regardless of genotype. Interestingly, when analyzing the PCA plots by age, genotypes appear to cluster more closely at 1-day, except daf-16 mutants which appear to cluster away from the rest (Figure 2G, 2H). This visual representation suggests that as animals age, their lipid profile may become more distinct by genotype. Thus, we performed more detailed analysis of specific changes.
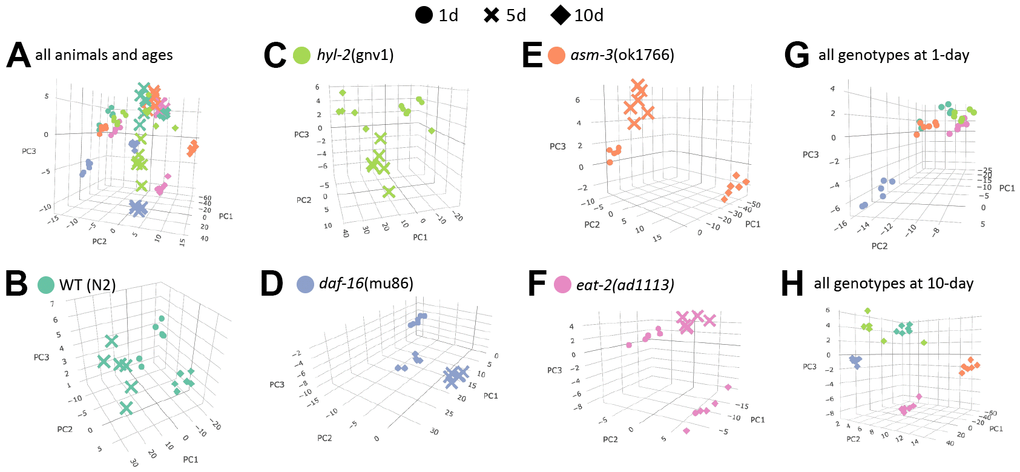
Figure 2. Age is a major determinant of lipid profiles in C. elegans. Principal component analysis (PCA) graphs show lipid profiles by 1-day (circles), 5-day (cross bars), and 10-day (diamonds). (A) PCA graph showing variation all groups, by strain and age. (B–F) PCA graphs showing variations in age by strain (different colors as indicated). (G–H) PCA graphs showing variations by 1-day old animals (G) and 10-day old animals (H).
Next, we determined whether age affected the lipidome within specific classes of lipids. To do this, we visualized lipid concentrations through heatmaps of free fatty acids (FFA) in N2, asm-3, and hyl-2 mutants (Figure 3A). Wildtype N2 animal show decreases in many shorter chained FFAs, particularly saturated FFA. The largest decreases were in FFA(20:0) (log2FC = -2.6, FDR=1.60e-15), FFA(18:0) (log2FC = -2.5, FDR=2.61e-19) (Supplementary Tables 2, 5). This observation is more pronounced in asm-3 mutants. However, hyl-2 mutants show increases in FFA of most types from 1 to 10 days, including many of shorter chained saturated and unsaturated FFAs; this is similar to the short-lived daf-16 mutant. Interestingly, long-lived eat-2 and daf-2 mutants have been shown to have lower amounts of shorter chained fatty acids (C14:0 - C20:0) [6], suggesting that shorter chain FA may contribute to aging. However, very long chain polyunsaturated FFAs increase with age in wildtype animals (Figure 3 and Supplementary Tables 2, 5). The largest changes of FFA from 1 day to 10 day N2 were in polyunsaturated FFA(20:2) (log2FC = 2.3, FDR=1.99e-34) and FFA(22:5) (log2FC = 1.30, FDR=1.75e-14). Interestingly, asm-3 mutants exhibit increases in many of the longer chained FFAs at 10 days compared to 1 day (Figure 3A and Supplementary Tables 3, 8).
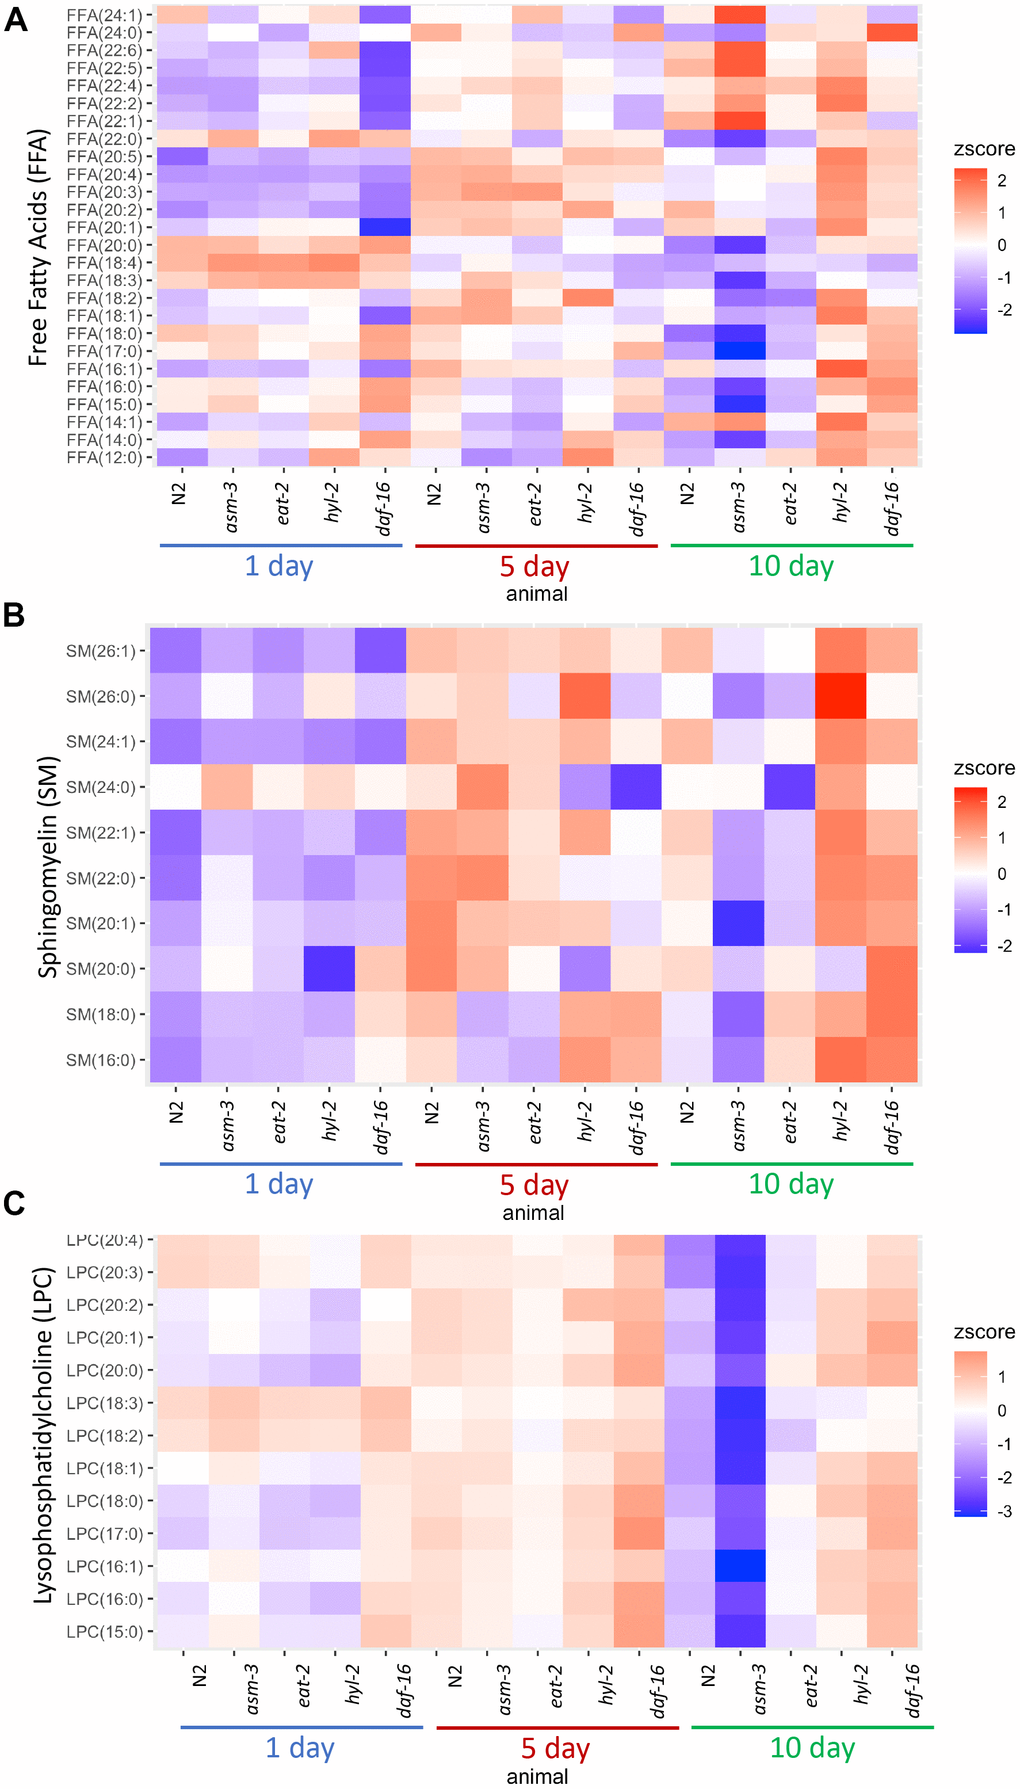
Figure 3. Lipid profiles vary by age and genotype. Heatmaps showing average z-score of log2 concentration for (A) free fatty acids (FFA), (B) sphingomyelins, and (C) lysophosphatidylcholines (LPCs). For sphingomyelins, the lipid ID does not include the 18:1 fatty acid chain, and LIPIDMAPS nomenclature is reported in Supplementary Table 11. Wildtype, asm-3, eat-2, hyl-2, and daf-16 worms were analyzed at 1-, 5- and 10-days old. For all, the heatmaps show averaged z scores for the six replicates in each group.
We then examined sphingomyelin (SM) profiles and found that, in general, SMs increase with age in N2 animals (Figure 3B and Supplementary Figure 3). This was also found by Cutler et al. (2014) that analyzed SM levels from egg to 11-day adults [25]. However, our analysis was different as we did not directly examine the d17:1 iso-sphingoid base that is most prominent in C. elegans [45]. Of the SMs we identified, we found that asm-3 mutants had higher total SMs compared to N2 at 1 day (p=0.03) but then was lower at 10 days compared to N2 (p<0.00001). In C. elegans, there are three acid sphingomyelinases genes (asm-1, 2, 3) and an uncharacterized neutral sphingomyelinase (T27F6.6). However, their adult expression patterns are unknown, and therefore, the different enzymes may differentially contribute to sphingolipid metabolism and total sphingomyelin levels throughout the worm’s life. Indeed, asm-1, asm-2, and asm-3 knockdown by RNAi lead to small increases in lifespan independently, and asm-1 and asm-2 knockdown by RNAi can further increase lifespan of asm-3 mutants [24].
Of the SMs we observed, which are more similar to mammalian SMs, the largest increases observed in N2 animals from 1-day to 10-day adults are in several monosaturated sphingomyelins, specifically SM(24:1) (log2FC = 2.6, FDR=2.43e-28), SM(22:1) (log2FC = 1.9, FDR=4.54e-10) and SM(26:1) (log2FC = 1.6, FDR=2.10e-8). Intriguingly, SM(24:1) abundance is low at 1-day in both N2 and hyl-2 mutants, and increases at both 5 and 10-days. However, in asm-3 mutants, SM(24:1) abundance is low at 1-day, increases at 5-days, and then decreases again at 10-days. Furthermore, asm-3 mutants exhibit different 10-to-1 day changes compared to N2; for example, whereas N2 show increases in the saturated sphingomyelins SM(16:0), SM(18:0), SM(22:0), asm-3 show decreases (Supplementary Tables 3, 8). Interestingly, the saturated sphingomyelins SM(16:0) (log2FC=1.9, FDR=2.38e-8), SM(18:0) (log2FC=1.3, FDR=0.026), and SM(22:0) (log2FC=0.47, FDR=0.0293) show even greater increases from 1 to 10 days in hyl-2 mutants than N2. Given the role of SMs on membrane fluidity, these age dependent changes may affect membrane properties in asm-3 and hyl-2 mutants that affect cell physiology.
To explore specific lipid changes associated with age, we next examined fold changes of each lipid molecule using volcano plots, plotting their concentration to their false discovery rate (FDR, or adjusted p value). Those lipids with greater than a 4-fold change (log2 FC > 2) are highlighted in Figure 4 (and Supplementary Tables 2–9). First, we examined changes in 10-day old N2 animals compared to 1-day old animals (10d/1d; Figure 4A); many of the lipids that are lower at 10 days compared to 1 day were LPCs, whereas many of the lipids that were higher at 10 days were triacylglycerols (Figure 4A). When examining changes in 5-day old N2 animals compared to 1-day animals, we observed similar changes in triacylglycerols, but not LPCs (Figure 4B). Next, we compared lipidomes of 10-day old animals of hyl-2, asm-3, daf-16, and eat-2 backgrounds to that of wildtype 10-day animals (Figure 4C–4F). Strikingly, the lipid changes in asm-3 to N2 were similar to that of the long-lived eat-2 to N2. Most of the highly significant changes were found to be lower levels of TAGs. Indeed, eat-2 animals exhibit reduced TAG levels by Nile Red, Oil red O, and Sudan black staining, as well as gas chromatography [46, 47]. On the other hand, the profile of lipid changes in hyl-2 to N2 was similar to that of the short-lived daf-16 to N2. Both 10-day old hyl-2 and daf-16 showed increases in LPCs compared to 10-day wildtype, sharing many common LPCs including LPC(16:1), LPC(18:3) and LPC(20:0).
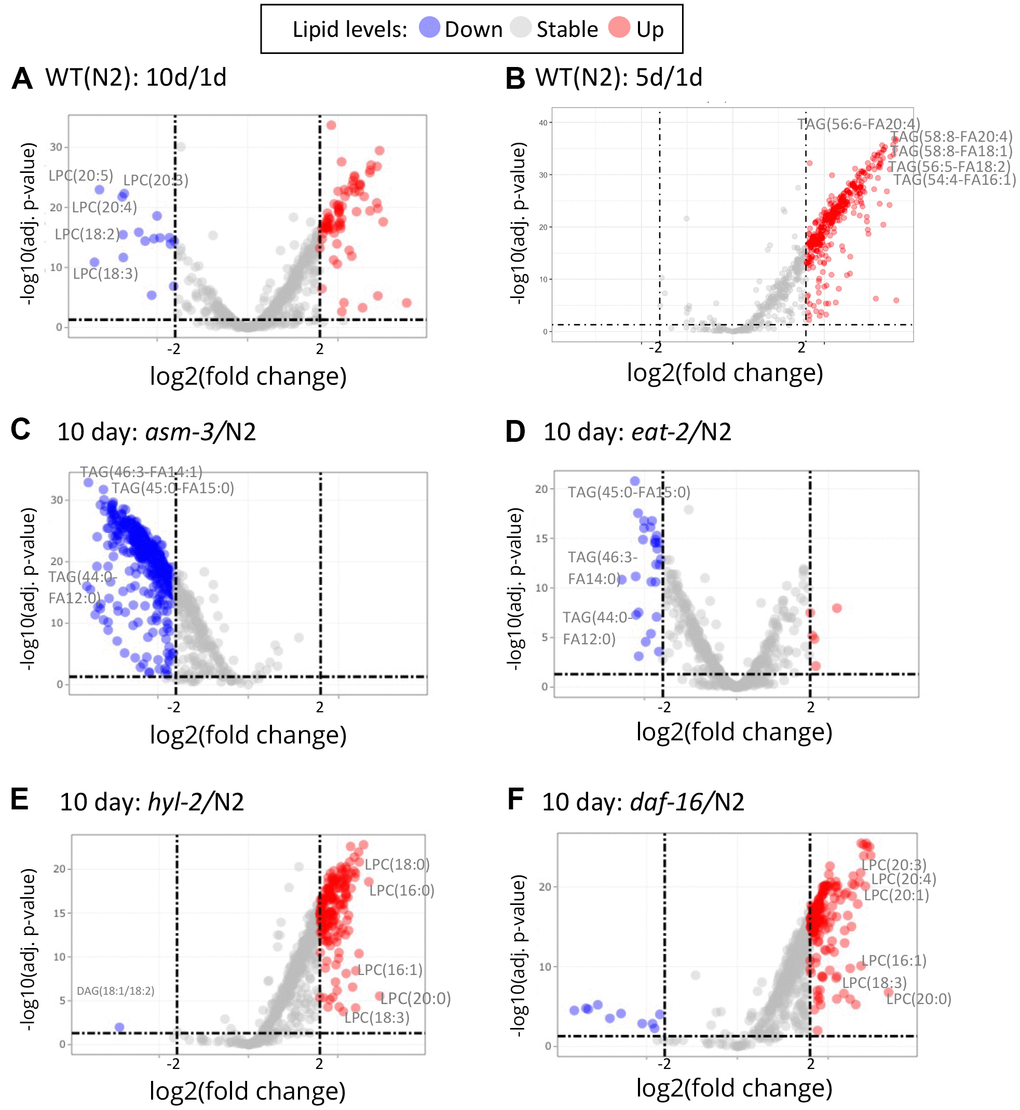
Figure 4. Volcano plots show that specific lipids change by age and genotype. Log2 fold changes between groups are graphed by adjusted P values. Red indicates a greater than 2 log2 fold increase of specific lipid, and blue indicates greater than -2 log2 fold decrease (dashed lines). (A) Comparison of 10-day old N2 animals versus 1-day old N2 animals (10d/1d). 10-day old N2 animals have many decreased LPCs compared to 1-day. (B) Comparison of 5-day old N2 animals versus 1-day old N2 animals. (C) Comparison of 10-day old asm-3 animals versus 10-day old N2 animals. (D) Comparison of 10-day old eat-2 animals versus 10-day old N2 animals. (E) Comparison of 10-day old hyl-2 animals versus 10-day old N2 animals. (F) Comparison of 10-day old daf-16 animals versus 10-day old N2 animals.
Given the changes in LPCs, we visualized differences in LPC levels across all animals in a heatmap (Figure 3C). We find that asm-3 and eat-2 show normal levels of LPCs at younger ages, but have much lower levels of LPCs at 10-days old. On the other hand, hyl-2 and daf-16 show increased LPC levels at younger and older ages. In humans, elevated levels of LPCs in circulating low density lipoprotiens (LDLs) are associated with disease [48], and elevated LPC levels are observed in stress conditions, particularly inflammatory disease [49].
Saturated and unsaturated fatty acid changes in hyl-2/CER synthase and daf-16/FOXO mutants
Fatty acid chain desaturation has been of interest in aging because polyunsaturated fatty acids (PUFAs) may be more susceptible to oxidation and cellular damage, suggesting that high levels of PUFAs may be detrimental to health. Indeed, older animals have a decreased monosaturated fatty acid to polyunsaturated fatty acid (MUFA:PUFA) ratio, suggesting that there are more PUFAs, or less MUFAs, with age; in addition, long-lived animals generally have a higher MUFA:PUFA ratio compared to short-lived animals [35, 36, 50]. We analyzed TAG and FFA and found that the MUFA:PUFA ratio declined in older ages for all genotypes (Figure 5A). However, when we analyzed total PUFAs, we found that both hyl-2 and daf-16 mutants had higher amounts of PUFAs than 10-day N2 animals (Figure 5B, 3.46 fold and 3.22 fold, p<1.0e-7 respectively). Both hyl-2 and daf-16 had PUFA levels at 1 day comparable to N2, but PUFA levels continued to increase significantly at each timepoint. Both asm-3 and eat-2 had non-significant changes at 10 days compared to N2. The changes in MUFA:PUFA ratio in older animals was not observed when we analyzed saturation levels in PC and PE (Figure 5B). However, we did find that hyl-2 and daf-16 mutants also had increased amounts of saturated lipids found in PC and PE (Figure 5D, 3.96 fold, and 5.28 fold increase respectively; p<1.0e-7 for both).
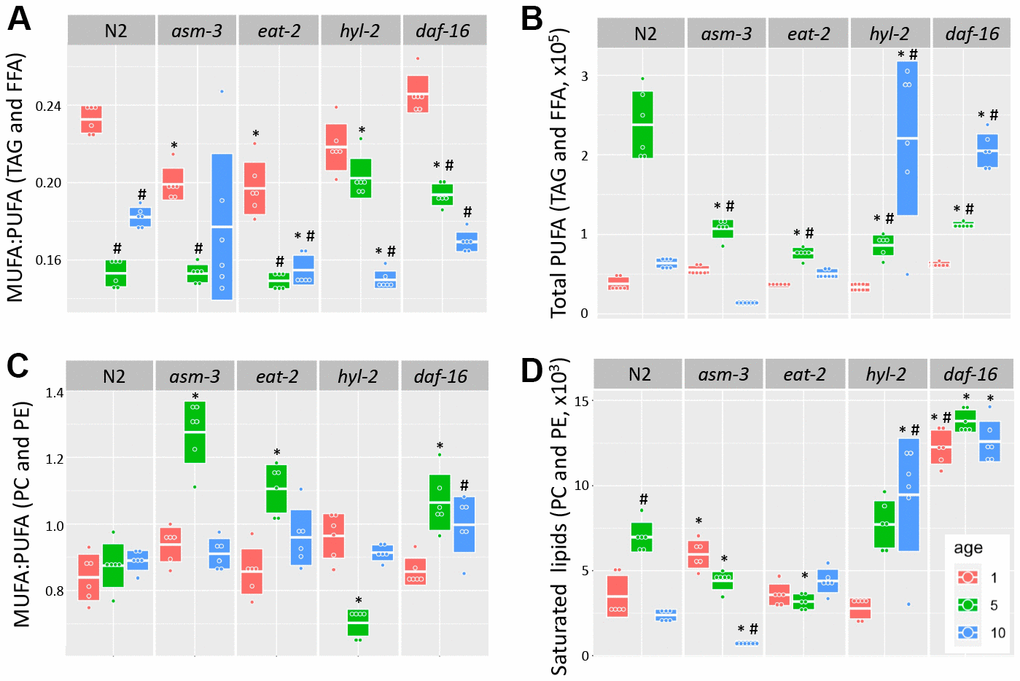
Figure 5. Analysis of acyl chain saturation during young and old asm-3 and hyl-2 mutants. Chain saturation was analyzed and compared between 1-day (red), 5-day (green), and 10-day (blue) old N2, asm-3, eat-2, hyl-2, and daf-16 animals. Total (A) MUFA:PUFA ratios in TAG and FFA, (B) total polyunsaturated chains in in TAG and FFA, (C) MUFA:PUFA ratios in PC and PE, and (D) saturated PC and PE were summed for each group (n=6). Boxes in graphs represent the middle quartile for the data points in each group. For all, # indicates p<0.05 compared to 1-day counterpart and * indicates p<0.05 compared to N2 counterpart.
Metabolic enzymes that produce elongated and desaturated fatty acids (Figure 1A) have been implicated in lifespan regulation [1, 13, 17, 31, 50]. Thus, we next explored whether aging affects gene expression of key enzymes in fatty acid lipid metabolism. Fatty acid metabolism starts with the fatty acid synthase FASN-1, which modifies malonyl-CoA to generate either C16 straight chain fatty acids by using Acetyl-CoA, or C13iso-branched fatty acid by using isovalaryl-CoA. From there, C16:0 can be elongated by fatty acid elongases or desaturated by fatty acid desaturases. We examined by qPCR whether elongases or desaturates are regulated by age or by mutations in hyl-2 and asm-3. We found that two fatty acid elongases (elo-1 and elo-2) did not change when comparing 1-day and 10-day old animals of any genotype (Figure 6A and Supplementary Table 10). When then analyzed fatty acid desaturases in the pathway (fat-1, fat-2, fat-4, fat-6, and fat-7). We found that 10-day old animals of all genotypes have very low expression of fat-7, which is a FA desaturase that converts FFA(18:0) to FFA(18:1). We did not observe changes in fat-6 expression or other fatty acid desaturases examined.
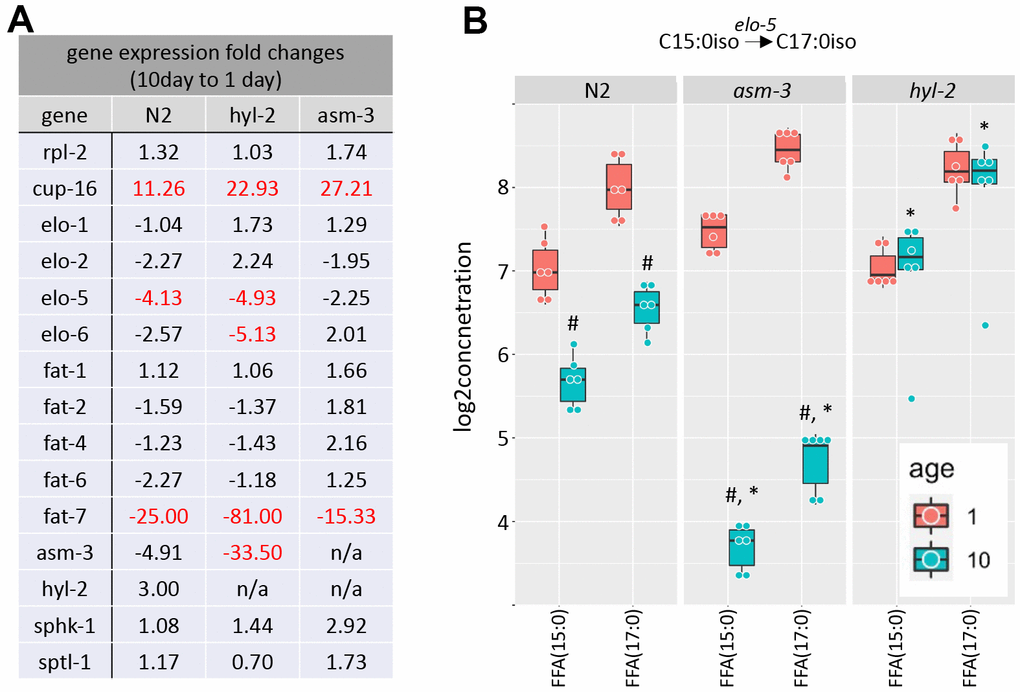
Figure 6. Saturated and polyunsaturated fatty acids metabolism. (A) Table of gene expression for fatty acid for elongases and desaturates examined in 1-day and 10-day old N2, asm-3, and hyl-2 animals by quantitative PCR. Data are represented by 2-ddCT fold change of 10-day N2 compared to 1-day values (n=3 for each group, red indicates fold changes that are p<0.01). The reference gene was rps-2, and rpl-2 and cup-16 are control genes known to remain unchanged and increase, respectively, in older animals. (B) Log2 concentrations of FFA(15:0) and FFA(17:0) are shown at 1- and 10-day old N2, asm-3, and hyl-2 animals (n=6 for each group). For all, #indicates p<0.05 compared to 1-day counterpart of the same genotype. *indicates p<0.05 compared to N2 counterpart of the same age.
C13:0iso-branched fatty acid leads to the synthesis of monomethyl branched chain fatty acids (mmBCFA), which are involved in growth and survival [51, 52]. ELO-5 and ELO-6 specifically transfer acyl groups to C13iso and C15iso fatty acids [51, 53]. We examined whether there were gene expression changes in elo-5 and elo-6 in 1- and 10-day old N2, hyl-2, and asm-3 animals. Interestingly, elo-5 showed significant decreases in wildtype and hyl-2 animals, and non-significant changes in asm-3 animals (Figure 6A). hyl-2 further shows significant downregulation of elo-6. The downregulation of elo-5 in N2 and asm-3 animals may contribute to the lower levels of FFA(17:0) (Figure 6B). However, it is not clear why hyl-2 mutants exhibit low expression of elo-5 and elo-6 despite sustained levels of FFA(17:0). It is possible some feedback mechanisms exist to decrease their expression, or that early steps in mmBCA synthesis are increased to affect sphingolipid metabolism in hyl-2. Indeed, many sphingomyelin species are higher in 10-day old hyl-2 mutants (Figure 3B) compared to both 1-day hyl-2 or N2 animals.
We found that the lipid levels of the FFA(15:0) and FFA(17:0) is increased in 10-day hyl-2 (log2FC=1.28, p=1.66e-10; Figure 6B) and daf-16 (log2FC=2.55, p=2.50e-23) mutants compared to N2. On the other hand, asm-3 animals showed decreases in FFA(15:0) and FFA(17:0) (log2FC=-1.98, p=1.10e-18) (Figure 6B). We were interested in whether the differences in these chains are also observed in triacylglycerols (TAGs). When analyzing FA15:0 and FA17:0 chains that are part of TAGs in asm-3 animals, we found that they also exhibited decreased TAGs containing FA15:0 and FA17:0 at 10-day compared to 1-day; hyl-2 mutants showed a general increase in in these TAGs compared to N2, but not in either specific day (Supplementary Figure 4). Although our lipidomics detection could not identify the iso-branched species specifically, this suggests that hyl-2 might have higher mmBCFAs at older ages, whereas asm-3 mutants have lower.
To determine whether sphingolipid metabolism itself is altered by age, we examined key enzymes in the production of sphingolipids from mmBCFAs. The mmBCFA C15iso and C17iso fatty acids can be made into C17iso-sphinganine or its precursors through serine palmitoyl transferase (sptl-1) in C. elegans (Figure 1A) [54, 55]. We found that sptl-1/serine palmitoyltransferase does not change with age or strain (Figure 6A). The addition of fatty acid to C17iso-sphinganine to make dihydroceramide is mediated by hyl-2, as well as other ceramide synthases (Figure 1A). hyl-2 specifically transfers fatty acids of shorter chains (C20-22) [40]. We further explored gene expression changes of hyl-2 and asm-3 itself, and found that asm-3 showed a trend to decrease in N2 animals at 10-days compared to 1-day (Figure 6A). However, we observed that, in general, asm-3 had low expression in all genotypes at 10-days. Interestingly, there was a large 10-day to 1-day decrease in asm-3 expression observed in hyl-2 animals. Thus, it is possible that hyl-2 animals, and old animals in general, have reduced breakdown of sphingomyelin at older ages that contribute to their poor stress response and reduced lifespan. However, given that asm-3 mutants have increased lifespan, it is not clear how reduced asm-3 expression at later ages may specifically modify aging processes differently than complete knockouts. Together, these data support a model where increased abundance of sphingolipid precursors and sphingomyelin may contribute to poor aging phenotypes. Indeed, our findings support lipidomic analyses of human longevity suggesting that centenarians upregulate mechanisms to upregulate sphingomyelins to ceramide-containing glycosphingolipids [56, 57].
Discussion
Ceramide synthase and sphingomyelinase are enzymes in sphingolipid metabolism that impact sphingomyelin and ceramide levels and aging. We examined lipidomes of mutants for these sphingolipid metabolism enzymes in C. elegans and observed lipid changes that may begin to elucidate how sphingolipid alterations might alter broad lipid composition. We found that hyl-2/CER synthase mutants have poor stress response and have many similar lipidomic changes as the short-lived daf-16/FOXO mutant. These include increased total PUFAs and increases in specific LPCs. Conversely, asm-3/acid sphingomyelinase mutants have slight resistance to oxidative stress and have lipidomic changes more similar to the long-lived eat-2/mAChR model. Further analyses of specific lipid changes may provide insight into how these sphingolipid mutants may mediate stress response and aging. As lipid composition changes with age, better understanding of lipid signatures in mutant models may become useful for aging studies.
Sphingolipid metabolism changes associated with aging
Sphingolipids are gaining attention in their roles in aging but have diverse and complex functions in cells. Sphingomyelins (SM) are among the most prevalent lipids found on cell membranes, and they influence membrane fluidity and cell signaling. We found that most SMs increase with age in general, and asm-3/acid SMase mutants had differing SM profiles than N2. Specifically, 10-day old wild type animals have increased longer chained SMs. While our study did not examine the more abundant d17:1 sphingoid species of SM, our finding supports previous studies of SM changes with age, which show that wildtype animals generally have greater SM elongation (increase C22:0 and C24:0 in 11-day adults compared to 3-day adults) and desaturation (less C18:0) [25]. Longer acyl chained SM create interdigitating acyl chains, which can reduce membrane mobility, and may contribute to the decrease in membrane fluidity observed in aging animals and senescent cells [58–60]. Interestingly, blood serum sphingomyelin is elevated with age and is associated with Alzheimer’s disease [61]. In addition, in the Baltimore longitudinal study, Mielke et al. (2014) found that most SMs increase with age, particularly in female subjects; however, some longer chained saturated SMs (C20:0, C22:0 and C24:0) increase in early aging but may decrease with late age (>70years old) [22]. Saturated sphingomyelins also appear correlated with obesity and insulin resistance [62].
Why might changes in sphingolipid metabolism cause alterations in adult stress response and lifespan? Ceramides, which can be produced by synthesis (ceramide synthases) or recycling through sphingomyelin (sphingomyelinases), have been found to be important for anoxia, autophagy, mitochondrial stress response, locomotion and others in C. elegans [38, 40, 63, 64]. Thus, it is likely that altered activity of enzymes such as ceramide synthases and acid sphingomyelinases serve broad roles in aging physiology. More studies showing direct impact of lipid changes will help elucidate how sphingolipids may mediate cellular processes associated with aging. For example, Wang et al. (2021) show that glucosylceramides mediate clathrin binding to autophagolysosome for lysosome recycling. Furthermore, SM levels and ASM-3 function have been associated with insulin receptors signaling, suggesting that loss of specific SM may reduce or alter receptor abundance or localization [24, 61, 65]. Indeed, Kim and Sun (2012) show that mutations or pharmacological inhibition decreasing asm-3 function increases lifespan and possibly through altered localization of the DAF-2/insulin-like receptors, or downstream targets, that are associated with stress response and aging in worms. However, the specific sphingomyelins species were not examined in these studies, and further characterization of specific carbon length and saturation may provide greater insight into mechanisms of sphingomyelin regulation of aging. On the other hand, studies on Drosophila cpes mutants, which have reduced ceramide phosphoethanolamine (CPE) – a structural analog of mammalian sphingomyelin – show that CPE has a positive correlation to lifespan increase; specifically, the presence of CPE on glial membranes alters circadian rhythms, glutamate homeostasis and shortens lifespan [66]. Furthermore, sphingolipids on synaptic vesicles have been shown to mediate SNARE proteins and exocytosis [67]. Thus, changes in SMs may alter specific organelle and cell membrane composition that impacts local protein-lipid interactions.
Interestingly, we found that asm-3 gene expression decreases with age, suggesting that sphingomyelin breakdown and broad lipid profiles may change during aging. Indeed, examining SM show that SMs increase with age, and are higher in short-lived animals. However, lipid profiles may be highly specific to the organism, as higher sphingolipid saturation overall was also observed in other long-living species [3]. It is worth noting that there are also race specific effects, as higher levels of sphingomyelins are observed in African Americans and Hispanics when compared to Caucasians [22, 68]. Thus, the changes in SMs are complex, and may involve specific lipids, interactions with other factors and protein functions. Though not definitive, studies suggest that specific sphingomyelins, and enzymes that alter carbon length or saturation, may play important roles in maintaining membrane sphingolipid composition important for many receptors or proteins associated with aging.
Fatty acids associated with fat storage and lipid oxidation
Free fatty acids (FFA) serve roles in both fat storage and membrane lipid composition. Fat storage is important for cellular energy and can change with age, but there is not a direct correlation between lipid levels and lifespan [69]. The dietary restriction mutant model eat-2 has lower fats in storage whereas the insulin signaling model daf-2(e1370) has high levels of TAG; yet both are long-lived [37, 41, 69–72]. Furthermore, effects may even be genotype dependent, as not all daf-2 mutant alleles share the higher TAG phenotype (Perez and Van Gilst 2008). However, higher TAG have been proposed to contribute to the longer lifespans of animals due to the greater reserve of stored fats for energy utilization in late life [13]. In other model organisms such as yeast, deletion of triglyceride lipases results in increased lipid accumulation as well as increased lifespan [18, 73].
Lipid droplets (LD) contain stored triacylglycerols, and these TAGs are broken down by enzymes that mediate lipophagy to make free fatty acids [16]. This process may involve autophagy genes as well as the lipase lipl-4 in C. elegans [74, 75]. Indeed, lipl-4 is required for the long lifespan phenotype of daf-2 mutants [76]. Interestingly, glycosphingolipids have recently been shown to mediate clathrin-dependent lysosome formation during autophagy, and increased autophagy in the long-lived hyl-1;lagr-1 ceramide synthase mutants (which produce longer chained ceramides) is abolished by loss of atg-12 [34, 63]. Thus, it is intriguing to speculate that changes in sphingolipid metabolism may mediate membrane dynamics that facilitate lipophagy. Indeed, acid sphingomyelinase (aSMase) is found in lysosomes, and asm-3/acid SMase is involved in lipid storage in embryos and may have roles in general lipid metabolism [77, 78]. However, Nile Red staining, which might more specifically label lysosomal lipids, did not show broad changes in lipids levels.
Fatty acids also make up more complex lipids that are part of cell and organelle membranes. The oxidative theory of aging suggests that increased lipids, such as polyunsaturated fatty acids (PUFAs), are more susceptible to oxidation and can lead to cell damage during aging [79, 80]. Indeed, elevated levels of PUFAs appear to increase oxidation and cell damage, and low PUFA levels correlate to longevity in mammals and worms [10, 50]. In C. elegans, PUFAs comprise 46% of total fatty acids of phospholipids but only 12% of triacylglycerols, suggesting that a greater percent of fatty acids is found in phospholipids than triacylglycerols [31]. We found that hyl-2/CER synthase and shorter lived daf-16 have higher amounts of many PUFAs, and this may contribute to their poor lifespan and healthspan in these animals. Many long-lived worms also have increases in MUFA:PUFA ratios, suggesting that there are less polyunsaturated fatty acids available for oxidative damage. Indeed, mutations in Δ9 desaturases (fat-5, fat-6, and fat-7), which produces PUFAs in C. elegans, or supplementation of the PUFA eicosapentaenoic acid (EPA) shortens lifespan [50]. However, ω-6 PUFAs has also been shown increase autophagy and extend lifespan [81]. This discrepancy is observed elsewhere as a study showed that centenarians increase ω-3 to ω-6 PUFAs [82]. Furthermore, long-lived daf-2 mutants have lower expression of fasn-1, a fatty acid synthase important for the initial steps of fatty acid production [83]. This may suggest a downregulation of the metabolic processes associated with fatty acid production, elongation, or desaturation mediates the effects of lipid metabolism on aging.
Phylogenomic studies have also identified evolutionary targets that link metabolic enzymes to longevity and include genes with functions in fatty acid elongation and desaturation [30]. We found that age decreases the expression of elo-5, which produces C15iso lipids and is important for development [51]. Interestingly, the long-lived phenotype of daf-2 is somewhat dependent on elo-5 [84]. We found that hyl-2 and daf-16 have increased levels of longer chained PUFAs at 10-days, compared to wildtype animals, suggesting that fatty acid metabolism in these animals may be increased. Shmookler-Reis (2011) also suggests that elongase activity negatively correlates with aging; specifically, the combined regulation for increased Δ9-desaturase activity to generate MUFAs, and decreased activity of downstream Δ5-desaturases that generate PUFAs, may correlate with longevity.
Different methodologies to lipid extractions can yield changes in lipid composition. We note that our protocol called for thawing frozen samples prior to lipidomics sample preparation. This freeze and thaw have been previously done on C. elegans for lipidomics [36, 85], and our quality control does not suggest degradation of any particular class of lipids. However, others have prepped from frozen C. elegans extracts directly [31]. Different tissue treatment conditions can damage tissues and result in elevations in FFA within samples [44]. Thus, total FFA and LPC levels may be impacted by sample preparation methods, although we do not suspect changes in relative values between genotypes emphasized in this analysis.
Lysophosphatidylcholines are increased in short-lived animals
High levels of LPCs may mediate cell stress. We found that LPCs were more abundant in short-lived mutants, hyl-2/CER synthase and daf-16/FOXO. LPCs can increase reactive oxygen species in aortic endothelial cells [86]. In addition, osmotic stress was shown to increase the production of LPC through daf-16, and that LPC(18:0) specifically caused osmotic stress mediated embryonic lethality [87]. Furthermore, daf-2/insulin-like receptor mutants exhibit 50% lower levels of LPCs compared to the wild type, including LPC(18:0) and PUFA containing LPCs (20:5, 20:4, and 20:3) [37]. In addition, Rebaudioside A, a sweetener that decreased ROS accumulation and improved oxidative stress response, caused decreased levels of LPC(20:4) and LPC(20:5) [88]. Intriguingly, human studies also show that LPC(20:3) and LPC(20:4) are lower in elderly [19]. On the other hand, others have shown that low levels of LPCs have also been linked to poor mitochondrial function [1]. Together, these data may suggest that regulation of LPC content may mediate mitochondrial function and oxidative stress in animals, and that low or high LPCs may affect healthspan or lifespan.
In summary, analyzing lipidomes of models of aging has the potential to identify cellular processes and signaling pathways important for animal stress response and aging. We found here that C. elegans hyl-2/CER synthase mutants had a 10-day lipid profile that mirrored shorter lived daf-16/FOXO mutants, which included elevated PUFAs and LPCs. Age caused increased sphingomyelin levels, particularly in short-lived animals. This may suggest that the regulation of sphingolipid metabolism may mediate changes in cell structure and function important for healthy aging. Future studies connecting lipidomic changes in sphingolipid metabolism mutants to mechanistic changes in cells of mutant models will be important next steps to better understanding the roles of sphingolipids in aging.
Materials and Methods
C. elegans strains
All C. elegans were grown on nematode growth media (NGM) at 20° C methods (Stiernagle 2006). Plates were seeded with OP50 E. coli. For lifespan and aging studies, NGM plates were supplemented with 50μM 5-Fluoro-2′-deoxyuridine (FUdR, Alfa Aesar). The following strains were provided by the CGC, which is funded by NIH Office of Research Infrastructure Programs (P40 OD010440): hyl-2(gnv1), asm-3(ok1744), eat-2(ad1113), and daf-16(mu86). The wildtype strain used was N2 Bristol. All strains were outcrossed at least 4x.
Oxidative stress assays
For stress assays, N2, hyl-2(gnv-1), and asm-3(ok1744) animals were synchronized via egg lay on NGM plates seeded with OP50 E. coli. When progeny reached the L4 stage, animals were washed with M9 and transferred to NGM/OP50 plates supplemented with 50μM FUdR. For acute juglone assays, animals were grown to 1-, 5-, and 10-day adults. At these ages, approximately 50 adult worms per genotype were transferred to 150μM juglone (Sigma Aldrich) in M9 by placing 10-15 animals per well for 4 wells, in a 96 well plate [89]. Worms were scored for survival every two hours for 8 hours. Animals were considered dead if they did not respond to agitation. Data was analyzed using Kaplan-Meier estimates and log-rank tests, with Bonferroni correction, in the R statistical package survival and survminer.
Nile red staining and imaging
To generate a synchronous population of worms, adult N2, hyl-2(gnv1), and asm-3(ok1744) animals were allowed to lay eggs for 4-6 hours on NGM plates seeded with OP50 E. coli. When progeny reached the L4 stage, they were moved onto OP50 E. coli seeded NGM plates supplemented with 50μM FUdR. At 1-day or 10-days after the L4 stage, animals stained with Nile Red as previously described previously [42]. Briefly, animals were washed with PBST, incubated in 40% isopropanol of 3 minutes, stained with Nile Red working solution (30μg/mL 40% isopropanol) for 2 hours, in the dark, shaking at room temperature. After incubation, worms were washed again with PBST in the dark for 30 minutes and worms were moved to a slide for imaging. Worms were imaged using an ECHO Revolve R4 microscope equipped with Olympus UPlan Fluorite objectives in the FITC/GFP channel. Images were then analyzed using ImageJ version 1.53e [90]. Whole worm fluorescence were used for statistical analysis, accounting for background fluorescence, and values were analyzed by two-way ANOVA and Tukey post-hoc tests in the R Statistical Package.
RNA isolation and real time quantitative polymerase chain reaction
N2, hyl-2(gnv1), and asm-3(ok1744) animals were synchronized using a standard egg prep protocol and distributed onto NGM plates supplemented with OP50. Once animals reached the L4 stage, they were transferred to NGM plates supplemented with 50μM FUdR and seeded with OP50. Approximately 500 worms per biological replicate were collected at 1 day and 10 days past the L4 stage and flash frozen using liquid nitrogen. RNA was isolated using TRIZOL (Sigma Aldrich) and chloroform extraction and then stored at -80° C. The absorbance at 260/280nm was measured using a NanoDrop Spectrophotometer (Thermo Fisher Scientific) to determine the purity of the RNA. cDNA was generated from ~500ng/μL of total RNA using the QuantiNova Reverse Transcription Kit (Qiagen). In the first step of the cDNA synthesis, all RNA was treated with a gDNA removal step to remove gDNA contamination. Quantitative, real-time polymerase chain reaction was performed in triplicate using the QuantiNova SYBR Green PCR Kit and Rotor Gene Q (Qiagen). mRNA fold changes were calculated using ddCT method (Wu, Tian et al. 2020). mRNA levels of the genes of interest were compared with the mRNA levels of the reference gene rps-2. Gene expression by qPCR was repeated with biological replicates and three technical replicates. All qPCR primers (Supplementary Table 1) were designed to be intron spanning, and one primer from each set was intron bridging to reduce the likelihood of gDNA amplification. Data were analyzed by two-way ANOVA and Tukey post-hoc tests in the R Statistical Package.
Sample preparation for lipidomics
Approximately 1000 C. elegans worms were synchronized by treating gravid adults with an alkaline hypochlorite solution (bleach/NaOH). Worms were then grown to L4 stage and transferred to NGM agar plates containing 50μM FUdR. Worms were then collected after 1, 5, and 10 days. Six replicate samples of each group were then sent for lipidomics analysis at the Northwest Metabolomics Research Center (University of Washington).
C. elegans samples were prepared as described (Hanson et al., 2020). Briefly, frozen worm samples were thawed and vortexed; 250μL of worm slurry was transferred to a borosilicate glass culture tube (16 × 100 mm). Next, 250μL of water, 1 mL of methanol, and 450μL of dichloromethane were added to all samples. Then, 25μL of the isotope labeled internal standards mixture were added and incubated at room temperature for 30 min. Next, another 500μL of water and 450μL of dichloromethane were added to the tube and centrifuged at 2500×g at 15° C for 10 min. The bottom organic layer was transferred to a new tube and 900μL of dichloromethane was added to the original tube for a second extraction. The combined extracts were concentrated under nitrogen and reconstituted in 250μL of the running solution (10mM ammonium acetate in 50:50 methanol:dichloromethane).
Mass spectrometry
C. elegans samples were analyzed as described by [91] and completed at the Northwest Metabolomics Research Center. Briefly, Quantitative lipidomics was performed with the Sciex Lipidyzer platform consisting of a Sciex QTRAP® 5500 mass spectrometer equipped with SelexION® for differential mobility spectrometry (DMS). 1-propanol was used as the chemical modifier for the DMS. Samples were introduced to the mass spectrometer by flow injection analysis at 8 μL/min. Each sample was injected twice, once with the DMS on (PC/PE/LPC/LPE/SM), and once with the DMS off (CE/ CER/DAG/DCER/FFA/HCER/ LCER/TAG). The lipid molecular species were measured using multiple reaction monitoring (MRM) and positive/negative polarity switching. A total of 1070 lipids and fatty acids were targeted in the analysis. Using 54 internal standards previously used and described in [92], quantities (in μmol/g) of each lipid species could be calculated. Data were acquired and processed using Analyst 1.6.3 and Lipidomics Workflow Manager 1.0.5.0.
Data processing and statistical analyses
Statistical analysis was carried out using R (version 3.6.0). The targeted lipidomic assay was designed to detect 1070 lipid species. Data were in concentration per worm weight (nmol/g of worm tissue (μM)), and therefore no further normalization was performed prior to statistical analysis. Only lipids in which missing data across all groups were less than 20% were included in further analysis. Out of the possible 1071 lipid species that the assay could detect, 701 lipids passed these filtering criteria and were included in further analysis. We used a quantile regression approach for the imputation of left-censored missing data (QRILC), which has been suggested as the favored imputation method for left-censored MNAR data [93]. This was implemented in the R imputeLCMD package.
We fit linear models to the lipidomic data using the Bioconductor limma package [94] to assess the difference in abundance between experimental groups. The limma package uses empirical Bayes moderated statistics, which improves power by ‘borrowing strength’ between features in order to moderate the residual variance [95]). We selected lipids with a false discovery rate (FDR) of 5%.
In the heatmaps, z-scores are calculated by adjusting the data, by feature, to have a mean of zero and a standard deviation of 1. The heatmaps were generated using the R statistical package. For direct comparisons of specific lipids between strains, log2 concentrations were compared between samples using a two-way ANOVA and Tukey post hoc analyses in the R statistical package.
Supplementary Materials
Author Contributions
JC conceived all experiments, collected and analyzed data, and wrote and edited the manuscript. TS and GM performed qPCR experiments and edited the manuscript. TS had additional roles in conceiving the experimental design and analyzing data. JR performed lipidomics sample collection, LB and DR performed sample preparations for lipid mass spectrometry, LW performed lipidomic analyses, and AK, GM, MG, MP, and SB performed physiological experiments.
Acknowledgments
We would like to thank Daniel Promislow and the Nathan Shock Center at the University of Washington for their support. We would like to thank the CGC for strains in this paper.
Conflicts of Interest
The authors declare that the research was conducted in the absence of any commercial or financial relationships that could be construed as a potential conflicts of interest.
Funding
Work was supported by the National Institutes of Aging (R15AG052933-03). Lipidomic analysis was further supported by the Nathan Shock Center grant (P30 AG013280) and an instrumentation grant (S10OD021562) to the Northwest Metabolomics Research Center.
References
- 1. Johnson AA, Stolzing A. The role of lipid metabolism in aging, lifespan regulation, and age-related disease. Aging Cell. 2019; 18:e13048. https://doi.org/10.1111/acel.13048 [PubMed]
- 2. Jové M, Mota-Martorell N, Pradas I, Galo-Licona JD, Martín-Gari M, Obis È, Sol J, Pamplona R. The Lipidome Fingerprint of Longevity. Molecules. 2020; 25:4343. https://doi.org/10.3390/molecules25184343 [PubMed]
- 3. Bozek K, Khrameeva EE, Reznick J, Omerbašić D, Bennett NC, Lewin GR, Azpurua J, Gorbunova V, Seluanov A, Regnard P, Wanert F, Marchal J, Pifferi F, et al. Lipidome determinants of maximal lifespan in mammals. Sci Rep. 2017; 7:5. https://doi.org/10.1038/s41598-017-00037-7 [PubMed]
- 4. Graessler J, Schwudke D, Schwarz PE, Herzog R, Shevchenko A, Bornstein SR. Top-down lipidomics reveals ether lipid deficiency in blood plasma of hypertensive patients. PLoS One. 2009; 4:e6261. https://doi.org/10.1371/journal.pone.0006261 [PubMed]
- 5. Han X, Rozen S, Boyle SH, Hellegers C, Cheng H, Burke JR, Welsh-Bohmer KA, Doraiswamy PM, Kaddurah-Daouk R. Metabolomics in early Alzheimer’s disease: identification of altered plasma sphingolipidome using shotgun lipidomics. PLoS One. 2011; 6:e21643. https://doi.org/10.1371/journal.pone.0021643 [PubMed]
- 6. Hu C, Kong H, Qu F, Li Y, Yu Z, Gao P, Peng S, Xu G. Application of plasma lipidomics in studying the response of patients with essential hypertension to antihypertensive drug therapy. Mol Biosyst. 2011; 7:3271–9. https://doi.org/10.1039/c1mb05342f [PubMed]
- 7. Naudí A, Cabré R, Jové M, Ayala V, Gonzalo H, Portero-Otín M, Ferrer I, Pamplona R. Lipidomics of human brain aging and Alzheimer’s disease pathology. Int Rev Neurobiol. 2015; 122:133–89. https://doi.org/10.1016/bs.irn.2015.05.008 [PubMed]
- 8. Stoessel D, Schulte C, Teixeira Dos Santos MC, Scheller D, Rebollo-Mesa I, Deuschle C, Walther D, Schauer N, Berg D, Nogueira da Costa A, Maetzler W. Promising Metabolite Profiles in the Plasma and CSF of Early Clinical Parkinson’s Disease. Front Aging Neurosci. 2018; 10:51. https://doi.org/10.3389/fnagi.2018.00051 [PubMed]
- 9. Meikle TG, Huynh K, Giles C, Meikle PJ. Clinical lipidomics: realizing the potential of lipid profiling. J Lipid Res. 2021; 62:100127. https://doi.org/10.1016/j.jlr.2021.100127 [PubMed]
- 10. Jové M, Naudí A, Aledo JC, Cabré R, Ayala V, Portero-Otin M, Barja G, Pamplona R. Plasma long-chain free fatty acids predict mammalian longevity. Sci Rep. 2013; 3:3346. https://doi.org/10.1038/srep03346 [PubMed]
- 11. Jové M, Naudí A, Gambini J, Borras C, Cabré R, Portero-Otín M, Viña J, Pamplona R. A Stress-Resistant Lipidomic Signature Confers Extreme Longevity to Humans. J Gerontol A Biol Sci Med Sci. 2017; 72:30–7. https://doi.org/10.1093/gerona/glw048 [PubMed]
- 12. Almeida I, Magalhães S, Nunes A. Lipids: biomarkers of healthy aging. Biogerontology. 2021; 22:273–95. https://doi.org/10.1007/s10522-021-09921-2 [PubMed]
- 13. Mutlu AS, Duffy J, Wang MC. Lipid metabolism and lipid signals in aging and longevity. Dev Cell. 2021; 56:1394–407. https://doi.org/10.1016/j.devcel.2021.03.034 [PubMed]
- 14. Pamplona R. Membrane phospholipids, lipoxidative damage and molecular integrity: a causal role in aging and longevity. Biochim Biophys Acta. 2008; 1777:1249–62. https://doi.org/10.1016/j.bbabio.2008.07.003 [PubMed]
- 15. Hansen M, Flatt T, Aguilaniu H. Reproduction, fat metabolism, and life span: what is the connection? Cell Metab. 2013; 17:10–9. https://doi.org/10.1016/j.cmet.2012.12.003 [PubMed]
- 16. Kounakis K, Chaniotakis M, Markaki M, Tavernarakis N. Emerging Roles of Lipophagy in Health and Disease. Front Cell Dev Biol. 2019; 7:185. https://doi.org/10.3389/fcell.2019.00185 [PubMed]
- 17. Bustos V, Partridge L. Good Ol’ Fat: Links between Lipid Signaling and Longevity. Trends Biochem Sci. 2017; 42:812–23. https://doi.org/10.1016/j.tibs.2017.07.001 [PubMed]
- 18. Li X, Handee W, Kuo MH. The slim, the fat, and the obese: guess who lives the longest? Curr Genet. 2017; 63:43–9. https://doi.org/10.1007/s00294-016-0617-z [PubMed]
- 19. Yang S, Dong Y, Liu Y, Yan X, Sun G, Jia G, Li X, Liu H, Su H, Li Y. Application of lipidomics strategy to explore aging-related biomarkers and potential anti-aging mechanisms of ginseng. Biogerontology. 2021; 22:589–602. https://doi.org/10.1007/s10522-021-09937-8 [PubMed]
- 20. Gonzalez-Covarrubias V, Beekman M, Uh HW, Dane A, Troost J, Paliukhovich I, van der Kloet FM, Houwing-Duistermaat J, Vreeken RJ, Hankemeier T, Slagboom EP. Lipidomics of familial longevity. Aging Cell. 2013; 12:426–34. https://doi.org/10.1111/acel.12064 [PubMed]
- 21. Montoliu I, Scherer M, Beguelin F, DaSilva L, Mari D, Salvioli S, Martin FP, Capri M, Bucci L, Ostan R, Garagnani P, Monti D, Biagi E, et al. Serum profiling of healthy aging identifies phospho- and sphingolipid species as markers of human longevity. Aging (Albany NY). 2014; 6:9–25. https://doi.org/10.18632/aging.100630 [PubMed]
- 22. Mielke MM, Bandaru VV, Han D, An Y, Resnick SM, Ferrucci L, Haughey NJ. Factors affecting longitudinal trajectories of plasma sphingomyelins: the Baltimore Longitudinal Study of Aging. Aging Cell. 2015; 14:112–21. https://doi.org/10.1111/acel.12275 [PubMed]
- 23. Braun F, Rinschen MM, Bartels V, Frommolt P, Habermann B, Hoeijmakers JH, Schumacher B, Dollé ME, Müller RU, Benzing T, Schermer B, Kurschat CE. Altered lipid metabolism in the aging kidney identified by three layered omic analysis. Aging (Albany NY). 2016; 8:441–57. https://doi.org/10.18632/aging.100900 [PubMed]
- 24. Kim Y, Sun H. ASM-3 acid sphingomyelinase functions as a positive regulator of the DAF-2/AGE-1 signaling pathway and serves as a novel anti-aging target. PLoS One. 2012; 7:e45890. https://doi.org/10.1371/journal.pone.0045890 [PubMed]
- 25. Cutler RG, Thompson KW, Camandola S, Mack KT, Mattson MP. Sphingolipid metabolism regulates development and lifespan in Caenorhabditis elegans. Mech Ageing Dev. 2014; 143:9–18. https://doi.org/10.1016/j.mad.2014.11.002 [PubMed]
- 26. Cutler RG, Mattson MP. Sphingomyelin and ceramide as regulators of development and lifespan. Mech Ageing Dev. 2001; 122:895–908. https://doi.org/10.1016/s0047-6374(01)00246-9 [PubMed]
- 27. Hannun YA, Obeid LM. Principles of bioactive lipid signalling: lessons from sphingolipids. Nat Rev Mol Cell Biol. 2008; 9:139–50. https://doi.org/10.1038/nrm2329 [PubMed]
- 28. Bieberich E. Sphingolipids and lipid rafts: Novel concepts and methods of analysis. Chem Phys Lipids. 2018; 216:114–31. https://doi.org/10.1016/j.chemphyslip.2018.08.003 [PubMed]
- 29. Sacket SJ, Chung HY, Okajima F, Im DS. Increase in sphingolipid catabolic enzyme activity during aging. Acta Pharmacol Sin. 2009; 30:1454–61. https://doi.org/10.1038/aps.2009.136 [PubMed]
- 30. Jobson RW, Nabholz B, Galtier N. An evolutionary genome scan for longevity-related natural selection in mammals. Mol Biol Evol. 2010; 27:840–7. https://doi.org/10.1093/molbev/msp293 [PubMed]
- 31. Brock TJ, Browse J, Watts JL. Fatty acid desaturation and the regulation of adiposity in Caenorhabditis elegans. Genetics. 2007; 176:865–75. https://doi.org/10.1534/genetics.107.071860 [PubMed]
- 32. Obeid LM, Hannun YA. Ceramide, stress, and a “LAG” in aging. Sci Aging Knowledge Environ. 2003; 2003:PE27. https://doi.org/10.1126/sageke.2003.39.pe27 [PubMed]
- 33. Kraut R. Roles of sphingolipids in Drosophila development and disease. J Neurochem. 2011; 116:764–78. https://doi.org/10.1111/j.1471-4159.2010.07022.x [PubMed]
- 34. Mosbech MB, Kruse R, Harvald EB, Olsen AS, Gallego SF, Hannibal-Bach HK, Ejsing CS, Færgeman NJ. Functional loss of two ceramide synthases elicits autophagy-dependent lifespan extension in C. elegans. PLoS One. 2013; 8:e70087. https://doi.org/10.1371/journal.pone.0070087 [PubMed]
- 35. Schroeder EA, Brunet A. Lipid Profiles and Signals for Long Life. Trends Endocrinol Metab. 2015; 26:589–92. https://doi.org/10.1016/j.tem.2015.08.007 [PubMed]
- 36. Wan QL, Yang ZL, Zhou XG, Ding AJ, Pu YZ, Luo HR, Wu GS. The Effects of Age and Reproduction on the Lipidome of Caenorhabditis elegans. Oxid Med Cell Longev. 2019; 2019:5768953. https://doi.org/10.1155/2019/5768953 [PubMed]
- 37. Prasain JK, Wilson L, Hoang HD, Moore R, Miller MA. Comparative Lipidomics of Caenorhabditis elegans Metabolic Disease Models by SWATH Non-Targeted Tandem Mass Spectrometry. Metabolites. 2015; 5:677–96. https://doi.org/10.3390/metabo5040677 [PubMed]
- 38. Chan JP, Brown J, Hark B, Nolan A, Servello D, Hrobuchak H, Staab TA. Loss of Sphingosine Kinase Alters Life History Traits and Locomotor Function in Caenorhabditis elegans. Front Genet. 2017; 8:132. https://doi.org/10.3389/fgene.2017.00132 [PubMed]
- 39. Hannun YA, Obeid LM. Sphingolipids and their metabolism in physiology and disease. Nat Rev Mol Cell Biol. 2018; 19:175–91. https://doi.org/10.1038/nrm.2017.107 [PubMed]
- 40. Menuz V, Howell KS, Gentina S, Epstein S, Riezman I, Fornallaz-Mulhauser M, Hengartner MO, Gomez M, Riezman H, Martinou JC. Protection of C. elegans from anoxia by HYL-2 ceramide synthase. Science. 2009; 324:381–4. https://doi.org/10.1126/science.1168532 [PubMed]
- 41. O’Rourke EJ, Soukas AA, Carr CE, Ruvkun G. C. elegans major fats are stored in vesicles distinct from lysosome-related organelles. Cell Metab. 2009; 10:430–5. https://doi.org/10.1016/j.cmet.2009.10.002 [PubMed]
- 42. Escorcia W, Ruter DL, Nhan J, Curran SP. Quantification of Lipid Abundance and Evaluation of Lipid Distribution in Caenorhabditis elegans by Nile Red and Oil Red O Staining. J Vis Exp. 2018; 57352. https://doi.org/10.3791/57352 [PubMed]
- 43. Kubagawa HM, Watts JL, Corrigan C, Edmonds JW, Sztul E, Browse J, Miller MA. Oocyte signals derived from polyunsaturated fatty acids control sperm recruitment in vivo. Nat Cell Biol. 2006; 8:1143–8. https://doi.org/10.1038/ncb1476 [PubMed]
- 44. Christie WW. Preparation of lipid extracts from tissues. 1993.
- 45. Hänel V, Pendleton C, Witting M. The sphingolipidome of the model organism Caenorhabditis elegans. Chem Phys Lipids. 2019; 222:15–22. https://doi.org/10.1016/j.chemphyslip.2019.04.009 [PubMed]
- 46. Brooks KK, Liang B, Watts JL. The influence of bacterial diet on fat storage in C. elegans. PLoS One. 2009; 4:e7545. https://doi.org/10.1371/journal.pone.0007545 [PubMed]
- 47. Bar DZ, Charar C, Dorfman J, Yadid T, Tafforeau L, Lafontaine DL, Gruenbaum Y. Cell size and fat content of dietary-restricted Caenorhabditis elegans are regulated by ATX-2, an mTOR repressor. Proc Natl Acad Sci USA. 2016; 113:E4620–9. https://doi.org/10.1073/pnas.1512156113 [PubMed]
- 48. Law SH, Chan ML, Marathe GK, Parveen F, Chen CH, Ke LY. An Updated Review of Lysophosphatidylcholine Metabolism in Human Diseases. Int J Mol Sci. 2019; 20:1149. https://doi.org/10.3390/ijms20051149 [PubMed]
- 49. Engel KM, Schiller J, Galuska CE, Fuchs B. Phospholipases and Reactive Oxygen Species Derived Lipid Biomarkers in Healthy and Diseased Humans and Animals - A Focus on Lysophosphatidylcholine. Front Physiol. 2021; 12:732319. https://doi.org/10.3389/fphys.2021.732319 [PubMed]
- 50. Shmookler Reis RJ, Xu L, Lee H, Chae M, Thaden JJ, Bharill P, Tazearslan C, Siegel E, Alla R, Zimniak P, Ayyadevara S. Modulation of lipid biosynthesis contributes to stress resistance and longevity of C. elegans mutants. Aging (Albany NY). 2011; 3:125–47. https://doi.org/10.18632/aging.100275 [PubMed]
- 51. Kniazeva M, Crawford QT, Seiber M, Wang CY, Han M. Monomethyl branched-chain fatty acids play an essential role in Caenorhabditis elegans development. PLoS Biol. 2004; 2:E257. https://doi.org/10.1371/journal.pbio.0020257 [PubMed]
- 52. Kniazeva M, Euler T, Han M. A branched-chain fatty acid is involved in post-embryonic growth control in parallel to the insulin receptor pathway and its biosynthesis is feedback-regulated in C. elegans. Genes Dev. 2008; 22:2102–10. https://doi.org/10.1101/gad.1692008 [PubMed]
- 53. Watts JL, Ristow M. Lipid and Carbohydrate Metabolism in Caenorhabditis elegans. Genetics. 2017; 207:413–46. https://doi.org/10.1534/genetics.117.300106 [PubMed]
- 54. Hannich JT, Mellal D, Feng S, Zumbuehl A, Riezman H. Structure and conserved function of iso-branched sphingoid bases from the nematode Caenorhabditis elegans. Chem Sci. 2017; 8:3676–86. https://doi.org/10.1039/c6sc04831e [PubMed]
- 55. Deng X, Kolesnick R. Caenorhabditis elegans as a model to study sphingolipid signaling. Biol Chem. 2015; 396:767–73. https://doi.org/10.1515/hsz-2014-0298 [PubMed]
- 56. Barbacini P, Torretta E, Arosio B, Ferri E, Capitanio D, Moriggi M, Gelfi C. Novel Insight into the Serum Sphingolipid Fingerprint Characterizing Longevity. Int J Mol Sci. 2022; 23:2428. https://doi.org/10.3390/ijms23052428 [PubMed]
- 57. Pradas I, Jové M, Huynh K, Ingles M, Borras C, Mota-Martorell N, Galo-Licona JD, Puig J, Viña J, Meikle PJ, Pamplona R. Long-lived Humans Have a Unique Plasma Sphingolipidome. J Gerontol A Biol Sci Med Sci. 2022; 77:728–35. https://doi.org/10.1093/gerona/glab360 [PubMed]
- 58. Chiantia S, London E. Acyl chain length and saturation modulate interleaflet coupling in asymmetric bilayers: effects on dynamics and structural order. Biophys J. 2012; 103:2311–9. https://doi.org/10.1016/j.bpj.2012.10.033 [PubMed]
- 59. Wahnon R, Mokady S, Cogan U. Age and membrane fluidity. Mech Ageing Dev. 1989; 50:249–55. https://doi.org/10.1016/0047-6374(89)90103-6 [PubMed]
- 60. Wi JH, Heo CH, Gwak H, Jung C, Kim SY. Probing Physical Properties of the Cellular Membrane in Senescent Cells by Fluorescence Imaging. J Phys Chem B. 2021; 125:10182–94. https://doi.org/10.1021/acs.jpcb.1c05403 [PubMed]
- 61. Jęśko H, Stępień A, Lukiw WJ, Strosznajder RP. The Cross-Talk Between Sphingolipids and Insulin-Like Growth Factor Signaling: Significance for Aging and Neurodegeneration. Mol Neurobiol. 2019; 56:3501–21. https://doi.org/10.1007/s12035-018-1286-3 [PubMed]
- 62. Hanamatsu H, Ohnishi S, Sakai S, Yuyama K, Mitsutake S, Takeda H, Hashino S, Igarashi Y. Altered levels of serum sphingomyelin and ceramide containing distinct acyl chains in young obese adults. Nutr Diabetes. 2014; 4:e141. https://doi.org/10.1038/nutd.2014.38 [PubMed]
- 63. Wang F, Dai Y, Zhu X, Chen Q, Zhu H, Zhou B, Tang H, Pang S. Saturated very long chain fatty acid configures glycosphingolipid for lysosome homeostasis in long-lived C. elegans. Nat Commun. 2021; 12:5073. https://doi.org/10.1038/s41467-021-25398-6 [PubMed]
- 64. Govindan JA, Jayamani E, Zhang X, Breen P, Larkins-Ford J, Mylonakis E, Ruvkun G. Lipid signalling couples translational surveillance to systemic detoxification in Caenorhabditis elegans. Nat Cell Biol. 2015; 17:1294–303. https://doi.org/10.1038/ncb3229 [PubMed]
- 65. Li Z, Zhang H, Liu J, Liang CP, Li Y, Li Y, Teitelman G, Beyer T, Bui HH, Peake DA, Zhang Y, Sanders PE, Kuo MS, et al. Reducing plasma membrane sphingomyelin increases insulin sensitivity. Mol Cell Biol. 2011; 31:4205–18. https://doi.org/10.1128/MCB.05893-11 [PubMed]
- 66. Chen X, Li J, Gao Z, Yang Y, Kuang W, Dong Y, Chua GH, Huang X, Jiang B, Tian H, Wang Y, Huang X, Li Y, et al. Endogenous ceramide phosphoethanolamine modulates circadian rhythm via neural-glial coupling in Drosophila. Natl Sci Rev. 2022; 9:nwac148. https://doi.org/10.1093/nsr/nwac148 [PubMed]
- 67. Darios F, Wasser C, Shakirzyanova A, Giniatullin A, Goodman K, Munoz-Bravo JL, Raingo J, Jorgacevski J, Kreft M, Zorec R, Rosa JM, Gandia L, Gutiérrez LM, et al. Sphingosine facilitates SNARE complex assembly and activates synaptic vesicle exocytosis. Neuron. 2009; 62:683–94. https://doi.org/10.1016/j.neuron.2009.04.024 [PubMed]
- 68. Nelson JC, Jiang XC, Tabas I, Tall A, Shea S. Plasma sphingomyelin and subclinical atherosclerosis: findings from the multi-ethnic study of atherosclerosis. Am J Epidemiol. 2006; 163:903–12. https://doi.org/10.1093/aje/kwj140 [PubMed]
- 69. Ackerman D, Gems D. The mystery of C. elegans aging: an emerging role for fat. Distant parallels between C. elegans aging and metabolic syndrome? Bioessays. 2012; 34:466–71. https://doi.org/10.1002/bies.201100189 [PubMed]
- 70. Shi X, Li J, Zou X, Greggain J, Rødkær SV, Færgeman NJ, Liang B, Watts JL. Regulation of lipid droplet size and phospholipid composition by stearoyl-CoA desaturase. J Lipid Res. 2013; 54:2504–14. https://doi.org/10.1194/jlr.M039669 [PubMed]
- 71. Vrablik TL, Petyuk VA, Larson EM, Smith RD, Watts JL. Lipidomic and proteomic analysis of Caenorhabditis elegans lipid droplets and identification of ACS-4 as a lipid droplet-associated protein. Biochim Biophys Acta. 2015; 1851:1337–45. https://doi.org/10.1016/j.bbalip.2015.06.004 [PubMed]
- 72. Berg M, Zhou XY, Shapira M. Host-Specific Functional Significance of Caenorhabditis Gut Commensals. Front Microbiol. 2016; 7:1622. https://doi.org/10.3389/fmicb.2016.01622 [PubMed]
- 73. Handee W, Li X, Hall KW, Deng X, Li P, Benning C, Williams BL, Kuo MH. An Energy-Independent Pro-longevity Function of Triacylglycerol in Yeast. PLoS Genet. 2016; 12:e1005878. https://doi.org/10.1371/journal.pgen.1005878 [PubMed]
- 74. Lapierre LR, Silvestrini MJ, Nuñez L, Ames K, Wong S, Le TT, Hansen M, Meléndez A. Autophagy genes are required for normal lipid levels in C. elegans. Autophagy. 2013; 9:278–86. https://doi.org/10.4161/auto.22930 [PubMed]
- 75. Yang P, Zhang H. You are what you eat: multifaceted functions of autophagy during C. elegans development. Cell Res. 2014; 24:80–91. https://doi.org/10.1038/cr.2013.154 [PubMed]
- 76. Lapierre LR, Gelino S, Meléndez A, Hansen M. Autophagy and lipid metabolism coordinately modulate life span in germline-less C. elegans. Curr Biol. 2011; 21:1507–14. https://doi.org/10.1016/j.cub.2011.07.042 [PubMed]
- 77. Jenkins RW, Canals D, Hannun YA. Roles and regulation of secretory and lysosomal acid sphingomyelinase. Cell Signal. 2009; 21:836–46. https://doi.org/10.1016/j.cellsig.2009.01.026 [PubMed]
- 78. Schmökel V, Memar N, Wiekenberg A, Trotzmüller M, Schnabel R, Döring F. Genetics of Lipid-Storage Management in Caenorhabditis elegans Embryos. Genetics. 2016; 202:1071–83. https://doi.org/10.1534/genetics.115.179127 [PubMed]
- 79. Wolff S, Dillin A. The trifecta of aging in Caenorhabditis elegans. Exp Gerontol. 2006; 41:894–903. https://doi.org/10.1016/j.exger.2006.06.054 [PubMed]
- 80. Liguori I, Russo G, Curcio F, Bulli G, Aran L, Della-Morte D, Gargiulo G, Testa G, Cacciatore F, Bonaduce D, Abete P. Oxidative stress, aging, and diseases. Clin Interv Aging. 2018; 13:757–72. https://doi.org/10.2147/CIA.S158513 [PubMed]
- 81. O’Rourke EJ, Kuballa P, Xavier R, Ruvkun G. ω-6 Polyunsaturated fatty acids extend life span through the activation of autophagy. Genes Dev. 2013; 27:429–40. https://doi.org/10.1101/gad.205294.112 [PubMed]
- 82. Rabini RA, Moretti N, Staffolani R, Salvolini E, Nanetti L, Franceschi C, Mazzanti L. Reduced susceptibility to peroxidation of erythrocyte plasma membranes from centenarians. Exp Gerontol. 2002; 37:657–63. https://doi.org/10.1016/s0531-5565(02)00006-2 [PubMed]
- 83. Depuydt G, Xie F, Petyuk VA, Smolders A, Brewer HM, Camp DG 2nd, Smith RD, Braeckman BP. LC-MS proteomics analysis of the insulin/IGF-1-deficient Caenorhabditis elegans daf-2(e1370) mutant reveals extensive restructuring of intermediary metabolism. J Proteome Res. 2014; 13:1938–56. https://doi.org/10.1021/pr401081b [PubMed]
- 84. Samuelson AV, Carr CE, Ruvkun G. Gene activities that mediate increased life span of C. elegans insulin-like signaling mutants. Genes Dev. 2007; 21:2976–94. https://doi.org/10.1101/gad.1588907 [PubMed]
- 85. Cheng X, Jiang X, Tam KY, Li G, Zheng J, Zhang H. Sphingolipidomic Analysis of C. elegans reveals Development- and Environment-dependent Metabolic Features. Int J Biol Sci. 2019; 15:2897–10. https://doi.org/10.7150/ijbs.30499 [PubMed]
- 86. Zou Y, Kim DH, Jung KJ, Heo HS, Kim CH, Baik HS, Yu BP, Yokozawa T, Chung HY. Lysophosphatidylcholine enhances oxidative stress via the 5-lipoxygenase pathway in rat aorta during aging. Rejuvenation Res. 2009; 12:15–24. https://doi.org/10.1089/rej.2008.0807 [PubMed]
- 87. Burton NO, Dwivedi VK, Burkhart KB, Kaplan RE, Baugh LR, Horvitz HR. Neurohormonal signaling via a sulfotransferase antagonizes insulin-like signaling to regulate a Caenorhabditis elegans stress response. Nat Commun. 2018; 9:5152. https://doi.org/10.1038/s41467-018-07640-w [PubMed]
- 88. Li P, Wang Z, Lam SM, Shui G. Rebaudioside A Enhances Resistance to Oxidative Stress and Extends Lifespan and Healthspan in Caenorhabditis elegans. Antioxidants (Basel). 2021; 10:262. https://doi.org/10.3390/antiox10020262 [PubMed]
- 89. Possik E, Pause A. Measuring oxidative stress resistance of Caenorhabditis elegans in 96-well microtiter plates. J Vis Exp. 2015; e52746. https://doi.org/10.3791/52746 [PubMed]
- 90. Schneider CA, Rasband WS, Eliceiri KW. NIH Image to ImageJ: 25 years of image analysis. Nat Methods. 2012; 9:671–75. https://doi.org/10.1038/nmeth.2089 [PubMed]
- 91. Hanson AJ, Banks WA, Bettcher LF, Pepin R, Raftery D, Craft S. Cerebrospinal fluid lipidomics: effects of an intravenous triglyceride infusion and apoE status. Metabolomics. 2019; 16:6. https://doi.org/10.1007/s11306-019-1627-x [PubMed]
- 92. Ghorasaini M, Mohammed Y, Adamski J, Bettcher L, Bowden JA, Cabruja M, Contrepois K, Ellenberger M, Gajera B, Haid M, Hornburg D, Hunter C, Jones CM, et al. Cross-Laboratory Standardization of Preclinical Lipidomics Using Differential Mobility Spectrometry and Multiple Reaction Monitoring. Anal Chem. 2021; 93:16369–78. https://doi.org/10.1021/acs.analchem.1c02826 [PubMed]
- 93. Wei R, Wang J, Su M, Jia E, Chen S, Chen T, Ni Y. Missing Value Imputation Approach for Mass Spectrometry-based Metabolomics Data. Sci Rep. 2018; 8:663. https://doi.org/10.1038/s41598-017-19120-0 [PubMed]
- 94. Ritchie ME, Phipson B, Wu D, Hu Y, Law CW, Shi W, Smyth GK. limma powers differential expression analyses for RNA-sequencing and microarray studies. Nucleic Acids Res. 2015; 43:e47. https://doi.org/10.1093/nar/gkv007 [PubMed]
- 95. Smyth GK. Linear models and empirical bayes methods for assessing differential expression in microarray experiments. Stat Appl Genet Mol Biol. 2004; 3:Article3. https://doi.org/10.2202/1544-6115.1027 [PubMed]