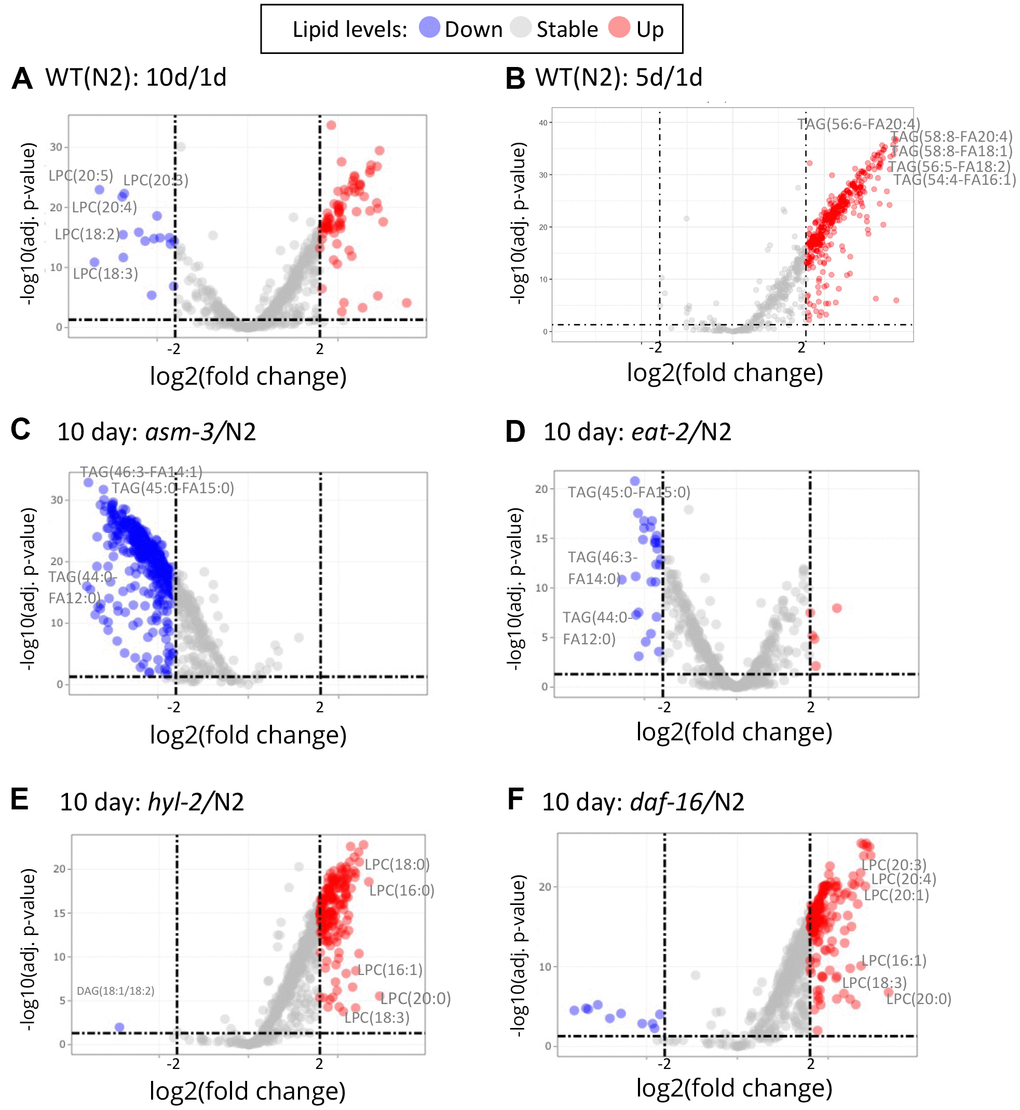
Figure 4.Volcano plots show that specific lipids change by age and genotype. Log2 fold changes between groups are graphed by adjusted P values. Red indicates a greater than 2 log2 fold increase of specific lipid, and blue indicates greater than -2 log2 fold decrease (dashed lines). (A) Comparison of 10-day old N2 animals versus 1-day old N2 animals (10d/1d). 10-day old N2 animals have many decreased LPCs compared to 1-day. (B) Comparison of 5-day old N2 animals versus 1-day old N2 animals. (C) Comparison of 10-day old asm-3 animals versus 10-day old N2 animals. (D) Comparison of 10-day old eat-2 animals versus 10-day old N2 animals. (E) Comparison of 10-day old hyl-2 animals versus 10-day old N2 animals. (F) Comparison of 10-day old daf-16 animals versus 10-day old N2 animals.