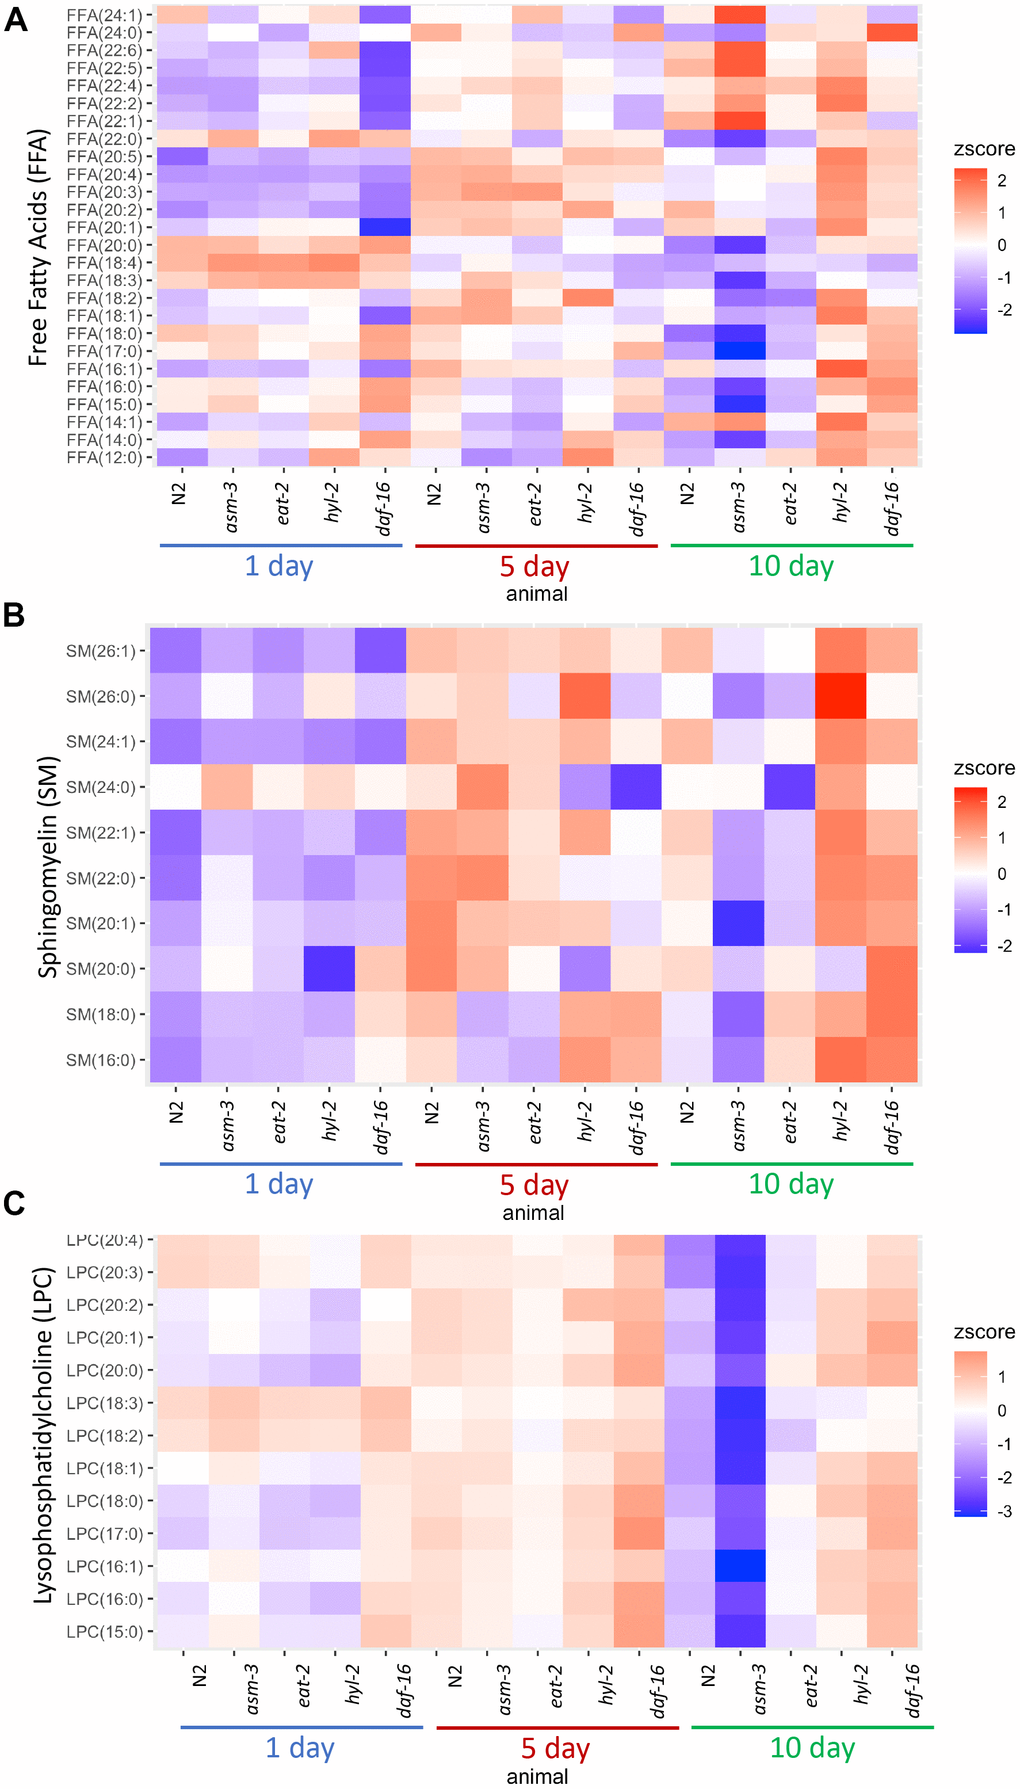
Figure 3.Lipid profiles vary by age and genotype. Heatmaps showing average z-score of log2 concentration for (A) free fatty acids (FFA), (B) sphingomyelins, and (C) lysophosphatidylcholines (LPCs). For sphingomyelins, the lipid ID does not include the 18:1 fatty acid chain, and LIPIDMAPS nomenclature is reported in Supplementary Table 11. Wildtype, asm-3, eat-2, hyl-2, and daf-16 worms were analyzed at 1-, 5- and 10-days old. For all, the heatmaps show averaged z scores for the six replicates in each group.