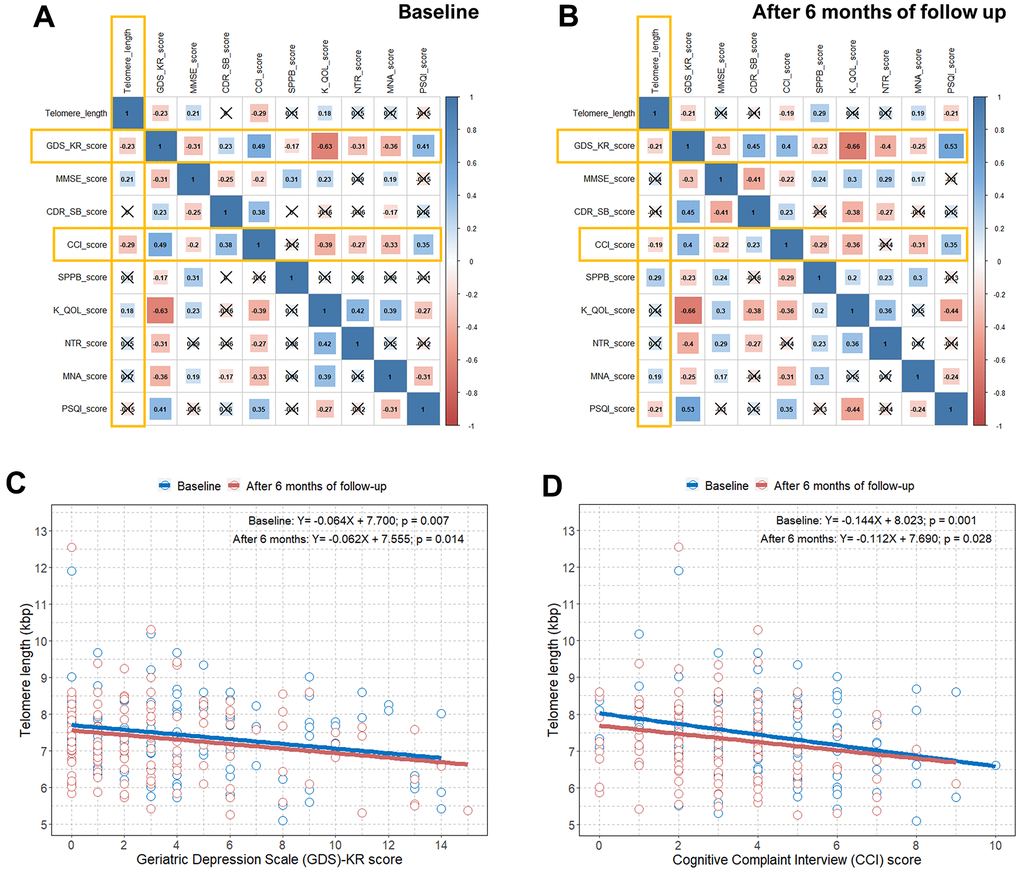
Figure 2.Correlation plots between TL and questionnaire and physical activity scores and associations between TL and the GDS-KR and CCI scores. (A) Pearson correlation coefficients and significance levels were calculated between TL and questionnaire and physical activity scores at baseline. The color-coordinated legend indicates the value and sign of Pearson’s correlation coefficient. The number in the box indicates Pearson’s correlation coefficient. Moreover, an x in the box indicates a p value≥0.005; (B) Pearson correlation coefficients and significance levels were calculated between TL and questionnaire and physical activity scores after six months of follow-up. The color-coordinated legend indicates the value and sign of Pearson’s correlation coefficient. The number in the box indicates Pearson’s correlation coefficient. Moreover, an x in the box indicates a p-value≥0.005; (C) scatterplot with a linear regression line showing the association between GDS-KR score and TL at baseline and after six months of follow-up; (D) scatterplot with a linear regression line showing the association between the CCI score and TL at baseline and after six months of follow-up. TL=telomere length; GDS-KR=Geriatric Depression Scale revised Korean version; CCI=Cognitive Complaint Interview.