


Introduction
Telomeres are regions of tandem repeats of the base pairs TTAGGG located at chromosomal ends and undergo attrition with each division of somatic cells [1]. Therefore, telomere length (TL) is known as an indicator of replicative history and the replicative potential of cells. Attrition in TL has been reported be an important determinant of human aging not only at the cellular level but also systemically [2]. Older adults have increased risks of both depression and neurocognitive impairment [3]. Therefore, many studies have shown that TL is associated with depression or/and cognitive impairment in the elderly [4–9]. Individuals with late-life depression have a higher risk of developing cognitive impairment, significant functional disability, and medical comorbidity burden than that in young adults with depression [10]. This increase in aging-related somatic symptoms is purportedly a consequence of accelerated biological aging in individuals with depression [11]. Several hypotheses have been proposed to explain the emergence of a prematurely aged phenotype in late-life depression, such as glucocorticoid cascade dysregulation, increased allostatic load, and telomere shortening [10, 12].
We previously reported the randomized controlled trial (RCT) of the SoUth Korean study to PrEvent cognitive impaiRment and protect BRAIN health through lifestyle intervention in at-risk elderly people (SUPERBRAIN) [13, 14]. In that SUPERBRAIN studies, we assessed the feasibility of the facility-based multidomain intervention (FMI) and home-based multidomain intervention (HMI) programs in at-risk older Koreans. At the time of the study, questionnaire and physical activity scores and several blood biomarkers including TL were measured twice: at baseline and after six months of follow-up. As described above, TL is associated with geriatric diseases, and we wanted to evaluate possible associations between TL and geriatric diseases such as depression or/and cognitive impairment in the elderly using the data from our SUPERBRAIN study. Although there are many reports that TL shortening is related to major depression or substantial cognitive impairment and dementia in the elderly, there have been relatively few papers demonstrating that TL shortening is related to early depression symptoms or cognitive complaints in the healthy elderly. Early detection of depression and cognitive impairment is important and has the potential to significantly delay disease progression [15, 16]. Moreover, individuals with late-life depression exhibit increased concentrations of proinflammatory cytokines [17, 18]. Inflammatory cytokine IL-6 is also reported to be associated with depression [19–21].
Therefore, we aimed to identify whether TL is associated with not only major depression or substantial cognitive decline and dementia but also with early subjective depressive symptoms or/and cognitive complaints in relatively healthy elderly subjects. This was possible because the SUPERBRAIN study initially excluded elderly individuals with major depression, dementia, or severe cognitive impairment from the study. In addition, we analyzed the relationship between various biomarkers related to geriatric diseases and TL.
Results
Characteristics of the study participants
Between May 29 and August 20, 2019, among 152 randomly assigned relatively healthy elderly participants (60–79 years old), 137 individuals who had TL measured both at baseline and after six months of follow-up were finally included in this randomized controlled prospective study. The average subject age was 70.8 years, and 74.5% of subjects were women (Table 1). The mean TLs at baseline and after six months of follow-up were 7.4 and 7.3 kbps, respectively. Based on a previous study, and considering our participants’ age range, the TL of our study participants were within the normal range [22]. More detailed information on the relationship between age and TL in the study participants is presented in Supplementary Figure 1. We observed that 24.8% of individuals had treatment histories for depressive symptoms. Further descriptive data are shown in Table 1.
Table 1. Characteristics of the study subjects.
| Characteristics | Total | ||||||||||||||||||||||||||||||||||||||||||||||||||||||||||||||||||||||||||||||||||||||||||||||||||
| Number | 137 | ||||||||||||||||||||||||||||||||||||||||||||||||||||||||||||||||||||||||||||||||||||||||||||||||||
| Sex, female, n (%) | 102 (74.5) | ||||||||||||||||||||||||||||||||||||||||||||||||||||||||||||||||||||||||||||||||||||||||||||||||||
| Age, mean ± SD, y | 70.8 ± 4.8 | ||||||||||||||||||||||||||||||||||||||||||||||||||||||||||||||||||||||||||||||||||||||||||||||||||
| Telomere length at baseline, mean ± SD, kbp | 7.4 ± 1.1 | ||||||||||||||||||||||||||||||||||||||||||||||||||||||||||||||||||||||||||||||||||||||||||||||||||
| Telomere length at baseline, median (IQR), kbp | 7.4 (6.7–8.1) | ||||||||||||||||||||||||||||||||||||||||||||||||||||||||||||||||||||||||||||||||||||||||||||||||||
| Telomere length after 6 months of follow-up, mean ± SD, kbp | 7.3 ± 1.1 | ||||||||||||||||||||||||||||||||||||||||||||||||||||||||||||||||||||||||||||||||||||||||||||||||||
| Telomere length after 6 months of follow-up, median (IQR), kbp | 7.3 (6.6–8.1) | ||||||||||||||||||||||||||||||||||||||||||||||||||||||||||||||||||||||||||||||||||||||||||||||||||
| BMI, mean ± SD, kg/m2 | 24.4 ± 2.8 | ||||||||||||||||||||||||||||||||||||||||||||||||||||||||||||||||||||||||||||||||||||||||||||||||||
| Treatment history for depressive symptoms, n (%) | |||||||||||||||||||||||||||||||||||||||||||||||||||||||||||||||||||||||||||||||||||||||||||||||||||
| Current | 26 (19.0) | ||||||||||||||||||||||||||||||||||||||||||||||||||||||||||||||||||||||||||||||||||||||||||||||||||
| Past | 8 (5.8) | ||||||||||||||||||||||||||||||||||||||||||||||||||||||||||||||||||||||||||||||||||||||||||||||||||
| No | 103 (75.2) | ||||||||||||||||||||||||||||||||||||||||||||||||||||||||||||||||||||||||||||||||||||||||||||||||||
| Family history of dementia, n (%) | 26 (19.0) | ||||||||||||||||||||||||||||||||||||||||||||||||||||||||||||||||||||||||||||||||||||||||||||||||||
| Hypertension, n (%) | 68 (49.6) | ||||||||||||||||||||||||||||||||||||||||||||||||||||||||||||||||||||||||||||||||||||||||||||||||||
| Diabetes, n (%) | 27 (19.7) | ||||||||||||||||||||||||||||||||||||||||||||||||||||||||||||||||||||||||||||||||||||||||||||||||||
| Hyperlipidemia, n (%) | 71 (51.8) | ||||||||||||||||||||||||||||||||||||||||||||||||||||||||||||||||||||||||||||||||||||||||||||||||||
| Heart disease, n (%) | 15 (10.9) | ||||||||||||||||||||||||||||||||||||||||||||||||||||||||||||||||||||||||||||||||||||||||||||||||||
| Stroke, n (%) | 14 (10.2) | ||||||||||||||||||||||||||||||||||||||||||||||||||||||||||||||||||||||||||||||||||||||||||||||||||
| SD, standard deviation; IQR, interquartile range; BMI, body mass index. | |||||||||||||||||||||||||||||||||||||||||||||||||||||||||||||||||||||||||||||||||||||||||||||||||||
Association between TL and depressive episodes requiring treatment
The boxplot shows no significant difference in the TL between baseline and after six months of follow-up in the elderly subjects in this study (Figure 1A). Interestingly, we found that the TL was significantly shorter in individuals with a treatment history for depressive symptoms than in individuals without a treatment history for depression (Figure 1B, 1C). The optimal cut-off values of the TL for predicting treatment history of depressive symptoms at baseline and after six months of follow-up were 6.835 (area under the curve [AUC]=0.664; p=0.004) and 6.605 (AUC=0.628; p=0.025), respectively (Figure 1D).
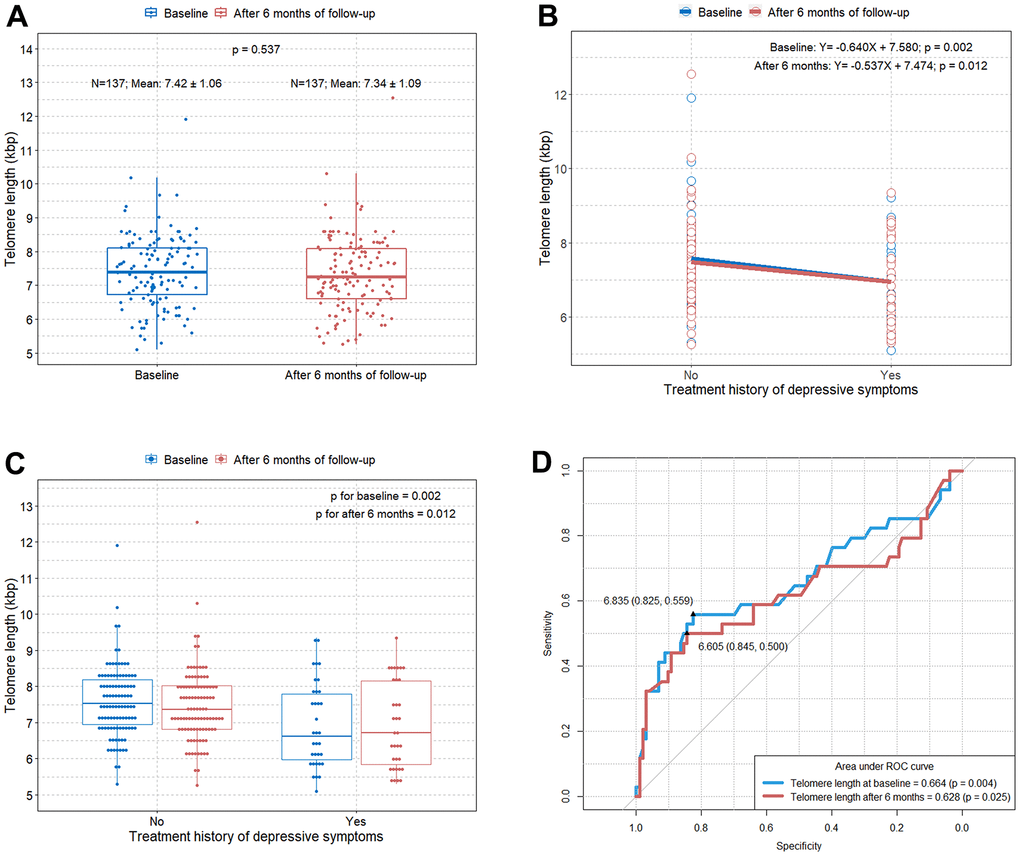
Figure 1. Comparison of TL according to the treatment history for depressive symptoms at baseline and after six months of follow-up. (A) Boxplot showing distributions of TLs in the study subjects at baseline and after six months of follow-up; (B) scatterplot with a linear regression line showing the difference in TL according to the treatment history for depressive symptoms at baseline and after six months of follow-up; (C) boxplot showing differences in TL according to the treatment history for depressive symptoms at baseline and after six months of follow-up; (D) ROC curve to identify the optimal cut-off values predicting depressive symptoms requiring treatment in elderly at baseline and after six months of follow-up. TL=telomere length; ROC=receiver operating characteristic.
Correlation between TL and subjective depressive symptoms and cognitive decline
We estimated the questionnaire and physical activity assessment scores at baseline and after six months of follow-up in all elderly subjects our study. There were statistically significant differences in the GDS-KR, CCI, SPPB, KQOL, and NTR scores between baseline and after six months of follow-up because 6-month intervention programs were implemented (Table 2). Unsurprisingly, there were strong inter-correlations between the questionnaire and physical activity assessment scores (Figure 2A, 2B). This is because cognitive decline (MMSE, CDR-SB, and CCI) and subjective depressive symptoms (GDS-KR) are interrelated, and they are known to be the major problems in the elderly [23]. Depression and cognitive impairment can subsequently affect physical activity (SPPB), quality of life (KQOL), nutrition status (NTR and MNA), and sleep quality (PSQI) in the elderly [23]. However, when we calculated the correlations between the questionnaire and physical activity assessment scores and TL, only the GDS-KR and CCI scores showed statistically significant associations with TL both at baseline and after six months of follow-up (an x in the box indicates a p-value≥0.005) (Figure 2A, 2B). The SUPERBRAIN study initially excluded elderly subjects with major depression, dementia, or severe cognitive impairment from the study; thus, the MMSE and CDR-SB, which are tools for dementia determination, were not associated with TL.
Table 2. Descriptive statistics of the questionnaire and physical activity scores and concentrations of several blood biomarkers.
| Baseline | After 6 months of follow-up | ||||||||||||||||||||||||||||||||||||||||||||||||||||||||||||||||||||||||||||||||||||||||||||||||||
| Questionnaire and physical activity score, mean ± SD | p | ||||||||||||||||||||||||||||||||||||||||||||||||||||||||||||||||||||||||||||||||||||||||||||||||||
| GDS-KR | 4.4 ± 3.8 | 3.5 ± 3.7 | 0.048 | ||||||||||||||||||||||||||||||||||||||||||||||||||||||||||||||||||||||||||||||||||||||||||||||||
| MMSE | 27.8 ± 2.0 | 27.9 ± 2.0 | 0.627 | ||||||||||||||||||||||||||||||||||||||||||||||||||||||||||||||||||||||||||||||||||||||||||||||||
| CDR-SB | 0.5 ± 0.5 | 0.5 ± 0.6 | 0.830 | ||||||||||||||||||||||||||||||||||||||||||||||||||||||||||||||||||||||||||||||||||||||||||||||||
| CCI | 4.2 ±2.1 | 3.1 ± 1.8 | <0.001 | ||||||||||||||||||||||||||||||||||||||||||||||||||||||||||||||||||||||||||||||||||||||||||||||||
| SPPB | 11.3 ± 1.3 | 11.7 ± 0.8 | 0.002 | ||||||||||||||||||||||||||||||||||||||||||||||||||||||||||||||||||||||||||||||||||||||||||||||||
| KQOL | 32.4 ± 6.0 | 34.3 ± 6.0 | 0.013 | ||||||||||||||||||||||||||||||||||||||||||||||||||||||||||||||||||||||||||||||||||||||||||||||||
| NTR | 64.8 ± 9.8 | 69.3 ± 9.0 | <0.001 | ||||||||||||||||||||||||||||||||||||||||||||||||||||||||||||||||||||||||||||||||||||||||||||||||
| MNA | 12.0 ± 2.1 | 12.5 ± 2.0 | 0.071 | ||||||||||||||||||||||||||||||||||||||||||||||||||||||||||||||||||||||||||||||||||||||||||||||||
| PSQI | 7.1 ± 3.8 | 6.9 ± 4.0 | 0.756 | ||||||||||||||||||||||||||||||||||||||||||||||||||||||||||||||||||||||||||||||||||||||||||||||||
| Concentration of blood biomarkers, mean ± SD, pg/ml | |||||||||||||||||||||||||||||||||||||||||||||||||||||||||||||||||||||||||||||||||||||||||||||||||||
| BDNF | 27612.5 ± 11784.2 | 28108.8 ± 13104.7 | 0.742 | ||||||||||||||||||||||||||||||||||||||||||||||||||||||||||||||||||||||||||||||||||||||||||||||||
| TREM2 | 4539.1 ± 2335.7 | 4150.3 ± 2312.7 | 0.167 | ||||||||||||||||||||||||||||||||||||||||||||||||||||||||||||||||||||||||||||||||||||||||||||||||
| IL-6 | 2.4 ± 2.9 | 2.1 ± 2.8 | 0.442 | ||||||||||||||||||||||||||||||||||||||||||||||||||||||||||||||||||||||||||||||||||||||||||||||||
| IL-18 | 160.8 ± 82.6 | 170.4 ± 87.5 | 0.350 | ||||||||||||||||||||||||||||||||||||||||||||||||||||||||||||||||||||||||||||||||||||||||||||||||
| IGF-1 | 87.5 ± 43.6 | 92.8 ± 51.2 | 0.360 | ||||||||||||||||||||||||||||||||||||||||||||||||||||||||||||||||||||||||||||||||||||||||||||||||
| YKL-40 | 78332.8 ± 74482.4 | 74351.6 ± 73748.3 | 0.657 | ||||||||||||||||||||||||||||||||||||||||||||||||||||||||||||||||||||||||||||||||||||||||||||||||
| TGF-β | 36127.3 ± 9828.1 | 35042.9 ± 11172.5 | 0.394 | ||||||||||||||||||||||||||||||||||||||||||||||||||||||||||||||||||||||||||||||||||||||||||||||||
| TNF-α | 0.6 ± 0.2 | 0.5 ± 0.2 | 0.045 | ||||||||||||||||||||||||||||||||||||||||||||||||||||||||||||||||||||||||||||||||||||||||||||||||
| VEGF | 265.6 ± 211.2 | 269.3 ± 237.7 | 0.891 | ||||||||||||||||||||||||||||||||||||||||||||||||||||||||||||||||||||||||||||||||||||||||||||||||
| NfL | 554.8 ± 330.1 | 468.8 ± 353.3 | 0.038 | ||||||||||||||||||||||||||||||||||||||||||||||||||||||||||||||||||||||||||||||||||||||||||||||||
| MCP-1 | 442.8 ± 314.0 | 415.4 ± 302.2 | 0.463 | ||||||||||||||||||||||||||||||||||||||||||||||||||||||||||||||||||||||||||||||||||||||||||||||||
| SD, standard deviation; GDS-KR, Geriatric Depression Scale revised Korean version; MMSE, Mini-Mental State Examination; CDR-SB, Clinical Dementia Rating-Sum of Boxes; CCI, Cognitive Complaint Interview; SPPB, Short Physical Performance Battery; KQOL, Korean Quality of Life; NTR, nutrition questionnaire for elderly; MNA, Mini Nutritional Assessment; PSQI, Pittsburgh Sleep Quality Index; BDNF, brain-derived neurotrophic factor; TREM2, triggering receptor expressed on myeloid cells 2; IL, interleukin; IGF-1, insulin-like growth factor 1; YKL-40, chitinase-3-like protein 1; TGF-β, transforming growth factor β; TNF-α, tumor necrosis factor α; VEGF, vascular endothelial growth factor; NfL, neurofilament light chain; MCP-1, monocyte chemoattractant protein 1. | |||||||||||||||||||||||||||||||||||||||||||||||||||||||||||||||||||||||||||||||||||||||||||||||||||
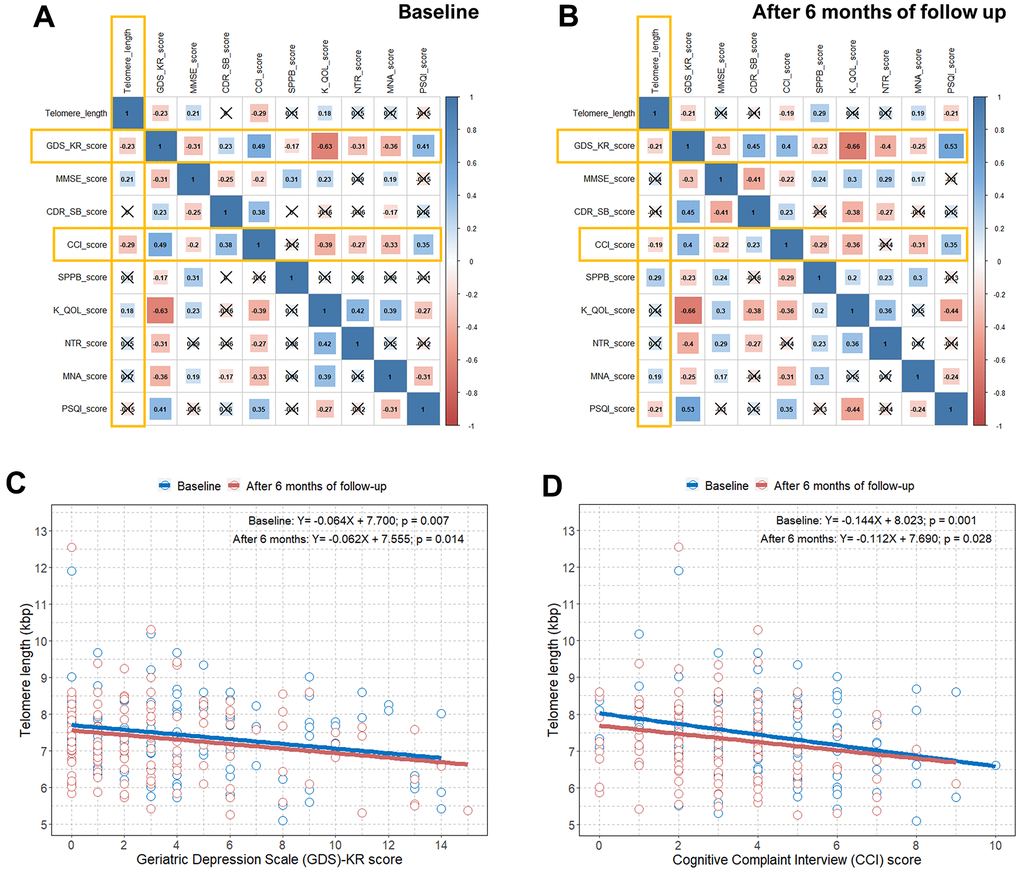
Figure 2. Correlation plots between TL and questionnaire and physical activity scores and associations between TL and the GDS-KR and CCI scores. (A) Pearson correlation coefficients and significance levels were calculated between TL and questionnaire and physical activity scores at baseline. The color-coordinated legend indicates the value and sign of Pearson’s correlation coefficient. The number in the box indicates Pearson’s correlation coefficient. Moreover, an x in the box indicates a p value≥0.005; (B) Pearson correlation coefficients and significance levels were calculated between TL and questionnaire and physical activity scores after six months of follow-up. The color-coordinated legend indicates the value and sign of Pearson’s correlation coefficient. The number in the box indicates Pearson’s correlation coefficient. Moreover, an x in the box indicates a p-value≥0.005; (C) scatterplot with a linear regression line showing the association between GDS-KR score and TL at baseline and after six months of follow-up; (D) scatterplot with a linear regression line showing the association between the CCI score and TL at baseline and after six months of follow-up. TL=telomere length; GDS-KR=Geriatric Depression Scale revised Korean version; CCI=Cognitive Complaint Interview.
We identified significant negative correlations between the GDS-KR and CCI scores and TL both at baseline and after six months of follow-up in Figure 2C, 2D. We observed an approximate decrease of 0.06 and 0.11−0.14 kbps in TL per one point increase in the GDS-KR and CCI scores, respectively, at baseline and after six months of follow-up. We also found a close relationship between subjective depressive symptoms and cognitive decline in relatively healthy elderly subjects, as shown in Supplementary Figure 2.
Correlation between TL and IL-6
We also obtained values of several biomarkers at baseline and after six months of follow-up in all elderly subjects in the study. There were significant differences in the TNF-α and NfL values between baseline and after six months of follow-up (Table 2). Moreover, the mean IL-6 levels at baseline and after six months of follow-up were 2.4 and 2.1 pg/mL, respectively. Compared to a previous study, the IL-6 levels in our participants at similar ages were generally similar or slightly higher [24]. Visualized information on the relationship between age and IL-6 in our study participants is presented in Supplementary Figure 3. When we estimated the correlations between the values of these biomarkers and TL, only IL-6 was significantly correlated with TL both at baseline and after six months of follow-up (an x in the box indicates a p-value≥0.005) (Figure 3A, 3B). There was no significant difference in IL-6 values between baseline and after six months of follow-up (Figure 3C). We found an approximate decrease of 0.08−0.09 kbps of TL per one point increase in IL-6 at baseline and after six months of follow-up (B, −0.085; p=0.006; B, −0.081; p=0.014, respectively) (Figure 3D).
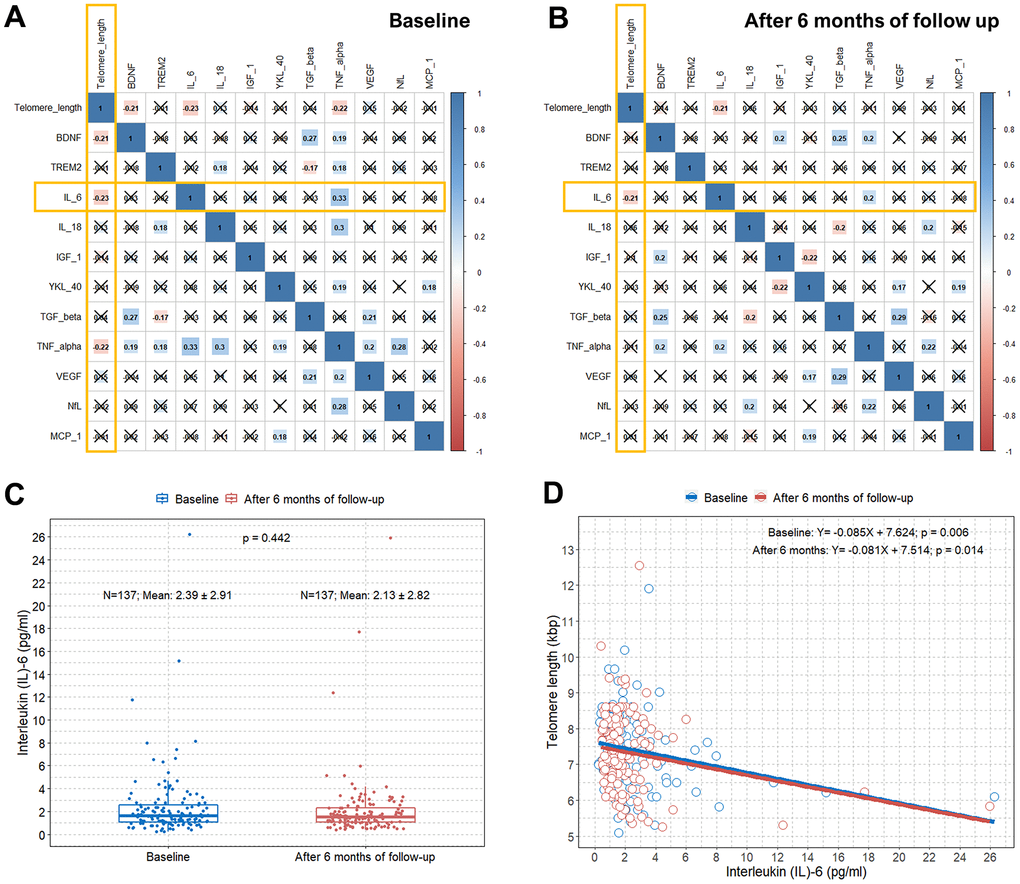
Figure 3. Correlation plots between TL and concentrations of several blood biomarkers and associations between TL and serum IL-6 levels. (A) Pearson correlation coefficients and significance levels were calculated between TL and concentrations of several blood biomarkers at baseline. The color-coordinated legend indicates the value and sign of Pearson’s correlation coefficient. The number in the box indicates Pearson’s correlation coefficient. Moreover, an x in the box indicates a p-value≥0.005; (B) Pearson correlation coefficients and significance levels were calculated between TL and concentrations of several blood biomarkers after six months of follow-up. The color-coordinated legend indicates the value and sign of Pearson’s correlation coefficient. The number in the box indicates Pearson’s correlation coefficient. Moreover, an x in the box indicates a p-value≥0.005; (C) Boxplot showing distributions of IL-6 levels in the study subjects at baseline and after six months of follow-up; (D) scatterplot with a linear regression line showing the association between IL-6 and TL at baseline and after six months of follow-up. TL=telomere length; IL-6= interleukin-6.
Discussion
We found that early and subjective depressive symptoms and cognitive complaints are associated with a relatively shorter TL among relatively healthy elderly individuals in the randomized controlled prospective SUPERBRAIN study. In addition, when analyzing the relationship between blood levels of several biomarkers and TL, a shorter TL was related to increased systemic levels of IL-6. It is possible that six months intervention programs affected the rate of TL shortening. However, according to our findings, there was no statistically significant difference in TL between baseline and after six months of follow-up (Figure 1A). We found that six months intervention programs affected the changes in GDS-KR and CCI scores and several biomarker values. Nevertheless, we believe that the results of this study showing that shorter TLs were still associated with increases in GDS-KR and CCI scores and systemic levels of IL-6 after six months of follow-up, as at baseline, are meaningful. To the best of our knowledge, this study is the first to show that TL is simultaneously associated with early and subjective depressive symptoms, cognitive complaints, and IL-6 in relatively healthy elderly individuals.
We measured scores related to subjective depressive symptoms using the 15-item GDS-KR and subjective cognitive decline with the CCI. The GDS is used widely as a screening instrument for early and subjective depressive symptoms in elderly [25, 26]. The CCI is a validated questionnaire for assessing subjective cognitive complaints and can be used in the early stages of dementia [27, 28].
Previous studies have reported that depression is associated with accelerated cellular aging and short TL [6–9]. It is well known that telomere shortening is a hallmark of biological age [2]. Major depressive disorder (MDD) is associated with accelerated cellular aging caused by the complex effects of several factors, such as the hypothalamic–pituitary–adrenal axis, brain-derived neurotrophic factor, mitochondrial DNA, telomerase, and inflammatory stress [7]. Among them, inflammatory pathways are known to be important factors influencing the connection between MDD and cellular aging [8]. A previous study described that IL-6 concentrations showed a significant inverse correlation with TL in the depressed group [6]. Our study also showed that a short TL was associated with subjective depressive symptoms and increased IL-6 levels among relatively healthy elderly individuals. Previous studies have also reported that IL-6 is associated with MDD [19–21]. Based on our findings, we believe that TL shortening in elderly is not only associated with advanced depression but also with early depressive symptoms. TL shortening is associated with increased IL-6 levels in the elderly, and we speculate that IL-6 may be a cytokine involved in depression from the early stages to advanced depression.
Depression in the elderly is often associated with cognitive symptoms, which range from normal cognitive changes in aging to mild cognitive impairment to dementia [3, 23]. In our study, we also observed that a shorter TL was associated with both subjective depressive symptoms and early cognitive complaint in relatively healthy elderly individuals. It has been reported that shortening of TL in the elderly is associated with decreased cognitive function [4, 5]. The cumulative load of high IL-6 and high TNF-α can lead to an increased risk of short TL [29]. Therefore, as TL shortening is associated with decreased cognitive function in elderly, cognitive decline may be also associated with IL-6 in the elderly. A previous study reported an association between elevated IL-6 levels and risk of subsequent decline in cognitive function [30]. This study showed that IL-6 may be involved in early cognitive decline in elderly [30]. Taken together, we believe that our study shows the possibility that TL shortening may be associated with early depressive symptoms and cognitive complaints in the elderly. In addition, we hypothesized that IL-6 might serve as an intermediate link between TL shortening and early depressive symptoms and cognitive complaints in the elderly (Figure 4).
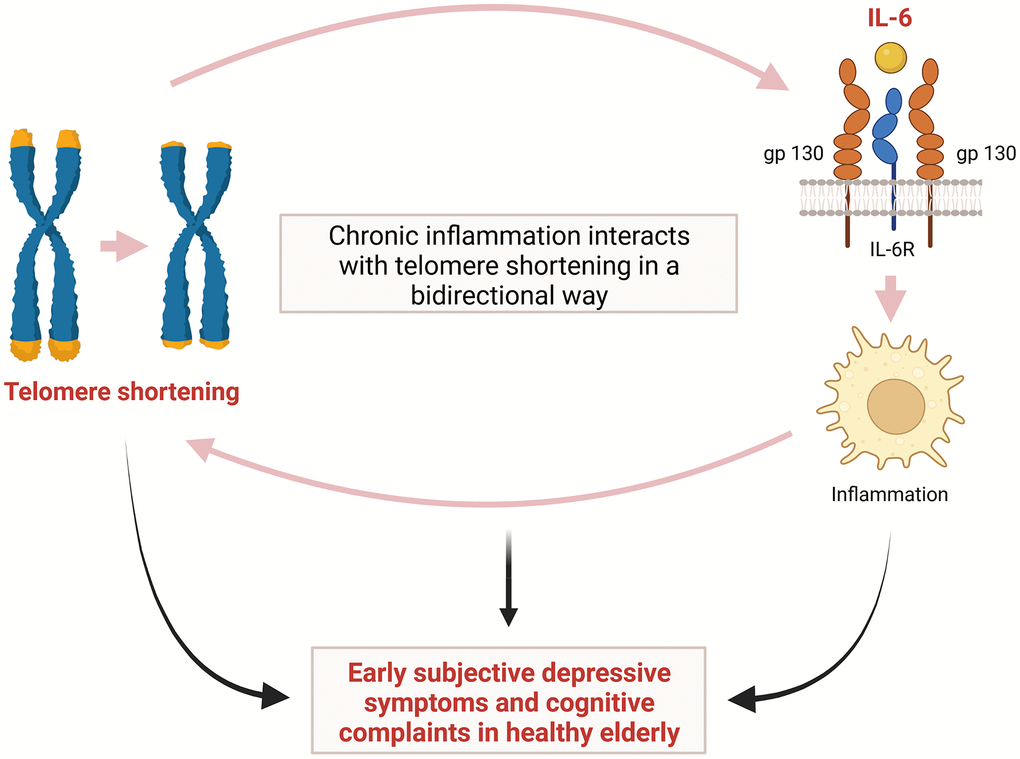
Figure 4. Hypothetical interaction between telomere shortening and inflammation induced by IL-6 leading to early subjective depressive symptoms and cognitive complaints in relatively healthy elderly. IL-6= interleukin-6.
The precise mechanism underlying the correlation of shorter TL with depression, cognitive decline, and inflammatory cytokines remains unclear. However, although the complexity of the crosstalk between the inflammatory response and telomere shortening/dysfunction has not yet been fully revealed, evidence has led to the hypothesis that chronic inflammation interacts with TL in a bidirectional way [31]. Namely, in addition to the shortening effects of chronic low-grade inflammation on TL, cells with a shortened TL are more likely to secrete proinflammatory cytokines such as IL-6, thereby accelerating inflammation [31, 32]. This repeated process may cause cumulative structural and functional changes in the brain, leading to cognitive impairment and mood disorders including depression [31, 33]. It has also been suggested that the main mechanism of telomere shortening/dysfunction induced by chronic inflammation is oxidative stress [34]. Telomeres are known to be particularly sensitive to damage by oxidative stress and inflammation causing oxidative damage, and they are significantly less proficient in repair of DNA damage [35]. This telomere shortening and dysfunction induced by oxidative stress and inflammation may play an important role in both depression and cognitive impairment [31, 36]. A previous study showed that decreased expression of genes encoding the telomerase enzyme and important oxidative defense enzymes, such as superoxide dismutase (SOD1 and SOD2), catalase (CAT), and glutathione peroxidase (GPX1) can lead to shortening of TL [37]. It was also suggested that DNA methylation might play an important role in mediating the interaction among depression, inflammation, and TL [38]. The authors also identified a gene co-methylation module related to the connection between a history of depression and inflammatory conditions as well as between TL and serum IL-6 levels [38].
Limitation of the study
First, this study was not originally designed to investigate the relationship between TL and subjective depressive symptoms and cognitive complaints in the elderly. Second, since this study was a feasibility RCT, it will be necessary to confirm the results of our study by performing large-scale RCT in the future. Third, the period between the two TL measurements was relatively short. Therefore, long-term changes in TL could not be analyzed. Fourth, the relatively small sample size in the present study may have influenced the results.
Conclusions
In conclusion, we showed that both early subjective depressive symptoms and cognitive complaints in relatively healthy elderly individuals were associated with a relatively shorter TL in the randomized controlled prospective SUPERBRAIN study. In addition, a shorter TL was associated with increased IL-6 levels in our study participants. We believe that IL-6, an inflammatory cytokine, plays an important role in the relationship of shortening TL with early subjective depressive mood and cognitive complaints. Although the results will need to be verified through a large-scale RCT in the future, we believe that our findings will help prevent and treat depression and cognitive impairment in the healthy elderly.
Materials and Methods
Study design and randomization
This study was a multicenter, outcome assessor-blinded, 24-week, RCT with a multi-arm parallel design performed in three hospitals and five public health centers across South Korea. The study participants were selected from among older adults who visited outpatient clinics or public health centers for memory complaints. As described in the Introduction, this study was originally designed to examine whether various outcomes were improved in the groups that received the FMI and HMI programs of the SUPERBRAIN compared with the control group. In a 1:1:1 ratio, participants were randomly assigned to the one of three groups: FMI, HMI, and control groups. Randomization was achieved through a permuted block randomization method, and the outcome assessors remained blinded to the assigned groups. Participants were instructed not to discuss their study involvement with the outcome assessor. We previously described the detailed study protocol [13, 14].
The study was performed in accordance with the International Conference on Harmonization Good Clinical Practices Guidelines. Institutional review boards approved the protocol and consent forms at each institution before the study began. Written informed consent was obtained from all potential study participants before their enrollment. This trial was registered with ClinicalTrials.gov (NCT03980392) [13, 14].
Characteristics of the study participants and clinical assessments
As reported in our previous study [13, 14], the inclusion criteria of the study were as follows: (1) age between 60 and 79 years, (2) at least one modifiable dementia risk factor such as hypertension, diabetes mellitus, hyperlipidemia, obesity, abdominal obesity, metabolic syndrome, smoking, educational level ≤ 9 years, physical inactivity, and social isolation, (3) Mini-Mental State Examination (MMSE) Z score of ≥ -1.5, (4) ability to independently perform activities of daily living, as evaluated by Korean instrumental activities of daily living (K-IADL) [39] score < 0.4, (5) ability to read and write in Korean, as evaluated by a literacy test [40], and (6) accessibility to a reliable informant who could provide investigators with the requested information. The exclusion criteria were as follows: major psychiatric illness; substantial cognitive decline or dementia; other neurodegenerative diseases such as Parkinson’s disease; malignancy within the last five years; cardiac stent or revascularization within the previous year; serious or unstable symptomatic cardiovascular diseases; other serious or unstable medical disease such as acute or severe asthma, active gastric ulceration, severe liver disease, or severe renal disease; any conditions preventing cooperation as determined by the study physician; a significant laboratory abnormality that may result in cognitive impairment; inability to safely participate in the exercise program; or simultaneous participation in any other intervention trial [13, 14].
Treatment history of depressive symptoms was defined as currently receiving treatment or having received treatment in the past for depressive symptoms. Hypertension was defined as a prescription for antihypertensive medication(s) or a measured systolic blood pressure > 140 mmHg and diastolic blood pressure > 90 mmHg. Diabetes mellitus was defined as a prescription of insulin or oral hypoglycemic medications, a high plasma glucose level (≥ 126 mg/dL), or a high glycated hemoglobin level (≥ 6.5%) after eight hours of fasting. Hyperlipidemia was defined as a prescription for lipid-lowering medications or high levels of total cholesterol (≥ 200 mg/dL), low-density lipoprotein cholesterol (≥ 130 mg/dL), and triglycerides (≥ 150 mg/dL) and low levels of high-density lipoprotein cholesterol (< 40 mg/dL). Heart disease was defined as a history of an acute coronary event or arrhythmia including atrial fibrillation or use of heart-related drugs. Stroke was defined as a history of cerebral infarction or hemorrhage such as intracerebral hemorrhage and subarachnoid hemorrhage.
TL assay and blood biomarkers
We obtained fasting blood samples from all participants at approximately 9 o’clock in the morning within four weeks before baseline and at the study endpoint. We previously described the detailed method of TL measurement as follows [41]: At baseline, whole blood from individuals was collected and separated into plasma and a buffy coat, and the leukocyte DNA was extracted using D-DEX™ IIb RBC lysis buffer and D-DEX™ IIb Cell lysis buffer (Intron, MA, USA). The DNA was then hydrated, and TLs were measured using a nonradioactive TeloTAGGG TL Assay (Roche Boehringer-Mannheim, Grenzach-Wyhlen, Germany). Briefly, 2–4 μg of DNA was fragmented and separated using agarose gel electrophoresis. The DNA fragments were then transferred to a nylon membrane (Millipore, Bedford, MA, USA) and incubated with digoxigenin (a digoxigenin-labeled probe), which specifically attaches to telomeric repeats. Next, the membranes were incubated with secondary antibodies conjugated with alkaline phosphatase. TLs were visually measured using chemiluminescence and an image analyzer (ImageQuant LAS 4000, GE Healthcare, Little Chalfont, UK). TLs were determined by comparing them to molecular weight standards.
Serum biomarkers such as brain derived neurotrophic factor (BDNF), triggering receptor expressed on myeloid cells 2 (TREM2), interleukin (IL)-6, IL-18, insulin-like growth factor 1 (IGF-1), YKL-40 (chitinase-3-like protein 1), transforming growth factor β (TGF-β), tumor necrosis factor α (TNF-α), vascular endothelial growth factor (VEGF), neurofilament light chain (NfL), and monocyte chemoattractant protein 1 (MCP-1) were also measured by a quantitative sandwich enzyme-linked immunosorbent assay [13].
Questionnaire and physical activity scores
Questionnaire and physical activity scores were measured at baseline and after six months of follow-up in all elderly participants in the study. Subjective depressive mood was assessed by the 15-item Geriatric Depression Scale revised Korean version (GDS-KR) [42]. Cognition decline was determined by MMSE and Clinical Dementia Rating-Sum of Boxes (CDR-SB) [43, 44]. Subjective cognitive problems were assessed by cognitive complaint interview (CCI) [27]. We assessed participant physical functioning with the Short Physical Performance Battery (SPPB) and quality of life with the Korean version of Quality of Life-Alzheimer’s disease (KQOL) questionnaire [45]. Nutrition status was evaluated by a nutrition questionnaire for the elderly (NTR) [46] and Mini Nutritional Assessment (MNA) [47]. The Pittsburgh Sleep Quality Index (PSQI) was used to assess sleep quality.
Statistical methods
Student’s t-test was performed to evaluate differences between values at baseline and after six months of follow-up. Box plots were used to visualize differences in TL and IL-6 levels at baseline and after six months of follow-up.
Receiver operating characteristic (ROC) curve analysis was used to determine the optimal cut-off TL that predicted depressive symptoms requiring treatment in the elderly. We used TL as the test variable and the treatment history of depressive symptoms as the state variable (dependent variable) in the ROC curve analysis. The optimal cut-off TL was defined as showing the shortest distance from the upper left corner (where sensitivity=1 and specificity=1).
Pearson’s correlation analysis was performed to evaluate the associations between TL and the questionnaire and physical activity scores and concentrations of blood biomarkers at baseline and after six months of follow-up.
Scatterplots with a regression line were constructed to determine whether TL was associated with GDS-KR and CCI scores and IL-6 levels. Multivariable linear regression analyses were also performed to identify whether GDS-KR and CCI scores and serum IL-6 levels were independently associated with TL. In addition to separately including GDS-KR, CCI score, and IL-6 level, covariates such as sex, age, BMI, hypertension, diabetes, hyperlipidemia, heart disease, and stroke history were entered into the multivariable model. For a comparison with the multivariable linear regression results, univariable linear regression analysis was also performed using the same variables as those used in the multivariable analysis (Supplementary Table 1).
A p-value < 0.05 was considered statistically significant. All statistical analyses were performed using R software version 4.1.2 and SPSS for Windows version 24.0 (IBM, Chicago, IL).
Author Contributions
Conception and design of the study: SHK, SHC, EHL, MHH. Performance of the research and experiments: SHK, SHC, EHL. Data acquisition: SHC, EHL. Data analysis/interpretation: MHH, EHL. Visualization: MHH. Manuscript writing: MHH. Contributed reagents/materials/analysis tools: SHK, SHC, HHP. Study supervision: SHK, SHC, HHP. Re-examination and revision of the paper: SHK, SHC, HHP.
Conflicts of Interest
There are no conflicts of interest to be declared.
Ethical Statement and Consent
Institutional review boards approved the protocol and consent forms at each institution before the study began. This study has been approved by Inha University Hospital Institutional Review Board (IRB)(INHAUH-2018-11-022), Ewha Womans University Mokdong Hospital IRB (EUMC-2019-04- 013), Ajou University Hospital IRB (AJIRB-BMR-SUR-19-070, AJIRB-BMR-SUR-19-077), Dong-A University Hospital IRB (DAUHIRB-19-078), and Chonnam National University Hospital IRB (CNUH-2019-139). Written informed consent was obtained from all potential study participants before their enrollment. This trial was registered with ClinicalTrials.gov (NCT03980392).
Funding
This study was supported by grants from the National Research Council of Science and Technology (NST) Aging Convergence Research Center (CRC22011-600), the Institute of Information and communications Technology Planning and Evaluation (IITP) (No. 2022-0-00448), and the Basic Science Research Program through the National Research Foundation of Korea (NRF) (NRF-2022R1F1A1063739 and NRF-2020M3E5D2A01084721) funded by the Ministry of Science and ICT, Republic of Korea, and from the Korea Health Technology R&D Project through the Korea Health Industry Development Institute (KHIDI) and Korea Dementia Research Center (KDRC) funded by the Ministry of Health and Welfare and Ministry of Science and ICT, Republic of Korea (HI20C0253, HU21C0113, HU21C0016, and HU21C0007), and the Medical Research Center (2017R1A5A2015395).
References
- 1. Koliada AK, Krasnenkov DS, Vaiserman AM. Telomeric aging: mitotic clock or stress indicator? Front Genet. 2015; 6:82. https://doi.org/10.3389/fgene.2015.00082 [PubMed]
- 2. Vaiserman A, Krasnienkov D. Telomere Length as a Marker of Biological Age: State-of-the-Art, Open Issues, and Future Perspectives. Front Genet. 2021; 11:630186. https://doi.org/10.3389/fgene.2020.630186 [PubMed]
- 3. Thomas AJ, O’Brien JT. Depression and cognition in older adults. Curr Opin Psychiatry. 2008; 21:8–13. https://doi.org/10.1097/YCO.0b013e3282f2139b [PubMed]
- 4. Yaffe K, Lindquist K, Kluse M, Cawthon R, Harris T, Hsueh WC, Simonsick EM, Kuller L, Li R, Ayonayon HN, Rubin SM, Cummings SR, and Health ABC Study. Telomere length and cognitive function in community-dwelling elders: findings from the Health ABC Study. Neurobiol Aging. 2011; 32:2055–60. https://doi.org/10.1016/j.neurobiolaging.2009.12.006 [PubMed]
- 5. Ma SL, Lau ESS, Suen EWC, Lam LCW, Leung PC, Woo J, Tang NLS. Telomere length and cognitive function in southern Chinese community-dwelling male elders. Age Ageing. 2013; 42:450–5. https://doi.org/10.1093/ageing/aft036 [PubMed]
- 6. Wolkowitz OM, Mellon SH, Epel ES, Lin J, Dhabhar FS, Su Y, Reus VI, Rosser R, Burke HM, Kupferman E, Compagnone M, Nelson JC, Blackburn EH. Leukocyte telomere length in major depression: correlations with chronicity, inflammation and oxidative stress--preliminary findings. PLoS One. 2011; 6:e17837. https://doi.org/10.1371/journal.pone.0017837 [PubMed]
- 7. Lin PY, Huang YC, Hung CF. Shortened telomere length in patients with depression: A meta-analytic study. J Psychiatr Res. 2016; 76:84–93. https://doi.org/10.1016/j.jpsychires.2016.01.015 [PubMed]
- 8. Kinser PA, Lyon DE. Major depressive disorder and measures of cellular aging: an integrative review. Nurs Res Pract. 2013; 2013:469070. https://doi.org/10.1155/2013/469070 [PubMed]
- 9. Humphreys KL, Sisk LM, Manczak EM, Lin J, Gotlib IH. Depressive Symptoms Predict Change in Telomere Length and Mitochondrial DNA Copy Number Across Adolescence. J Am Acad Child Adolesc Psychiatry. 2020; 59:1364–70.e2. https://doi.org/10.1016/j.jaac.2019.09.031 [PubMed]
- 10. Diniz BS. The Molecular Intersection Between Senescence and Major Depression in the Elderly. Am J Geriatr Psychiatry. 2018; 26:1097–105. https://doi.org/10.1016/j.jagp.2018.07.005 [PubMed]
- 11. Wolkowitz OM, Reus VI, Mellon SH. Of sound mind and body: depression, disease, and accelerated aging. Dialogues Clin Neurosci. 2011; 13:25–39. https://doi.org/10.31887/DCNS.2011.13.1/owolkowitz [PubMed]
- 12. Mendes-Silva AP, Vieira ELM, Xavier G, Barroso LSS, Bertola L, Martins EAR, Brietzke EM, Belangero SI, Diniz BS. Telomere shortening in late-life depression: A potential marker of depression severity. Brain Behav. 2021; 11:e2255. https://doi.org/10.1002/brb3.2255 [PubMed]
- 13. Moon SY, Hong CH, Jeong JH, Park YK, Na HR, Song HS, Kim BC, Park KW, Park HK, Choi M, Lee SM, Chun BO, Koh SH, et al. Facility-based and home-based multidomain interventions including cognitive training, exercise, diet, vascular risk management, and motivation for older adults: a randomized controlled feasibility trial. Aging (Albany NY). 2021; 13:15898–916. https://doi.org/10.18632/aging.203213 [PubMed]
- 14. Park HK, Jeong JH, Moon SY, Park YK, Hong CH, Na HR, Song HS, Lee SM, Choi M, Park KW, Kim BC, Cho SH, Chun BO, Choi SH. South Korean Study to Prevent Cognitive Impairment and Protect Brain Health Through Lifestyle Intervention in At-Risk Elderly People: Protocol of a Multicenter, Randomized Controlled Feasibility Trial. J Clin Neurol. 2020; 16:292–303. https://doi.org/10.3988/jcn.2020.16.2.292 [PubMed]
- 15. Halfin A. Depression: the benefits of early and appropriate treatment. Am J Manag Care. 2007; 13:S92–7. [PubMed]
- 16. Sabbagh MN, Boada M, Borson S, Doraiswamy PM, Dubois B, Ingram J, Iwata A, Porsteinsson AP, Possin KL, Rabinovici GD, Vellas B, Chao S, Vergallo A, Hampel H. Early Detection of Mild Cognitive Impairment (MCI) in an At-Home Setting. J Prev Alzheimers Dis. 2020; 7:171–8. https://doi.org/10.14283/jpad.2020.22 [PubMed]
- 17. Diniz BS, Mendes-Silva AP, Silva LB, Bertola L, Vieira MC, Ferreira JD, Nicolau M, Bristot G, da Rosa ED, Teixeira AL, Kapczinski F. Oxidative stress markers imbalance in late-life depression. J Psychiatr Res. 2018; 102:29–33. https://doi.org/10.1016/j.jpsychires.2018.02.023 [PubMed]
- 18. Saraykar S, Cao B, Barroso LS, Pereira KS, Bertola L, Nicolau M, Ferreira JD, Dias NS, Vieira EL, Teixeira AL, Silva APM, Diniz BS. Plasma IL-17A levels in patients with late-life depression. Braz J Psychiatry. 2017; 40:212–5. https://doi.org/10.1590/1516-4446-2017-2299 [PubMed]
- 19. Maes M, Meltzer HY, Bosmans E, Bergmans R, Vandoolaeghe E, Ranjan R, Desnyder R. Increased plasma concentrations of interleukin-6, soluble interleukin-6, soluble interleukin-2 and transferrin receptor in major depression. J Affect Disord. 1995; 34:301–9. https://doi.org/10.1016/0165-0327(95)00028-l [PubMed]
- 20. Ting EYC, Yang AC, Tsai SJ. Role of Interleukin-6 in Depressive Disorder. Int J Mol Sci. 2020; 21:2194. https://doi.org/10.3390/ijms21062194 [PubMed]
- 21. Hodes GE, Ménard C, Russo SJ. Integrating Interleukin-6 into depression diagnosis and treatment. Neurobiol Stress. 2016; 4:15–22. https://doi.org/10.1016/j.ynstr.2016.03.003 [PubMed]
- 22. Lucas CL, Zhang Y, Venida A, Wang Y, Hughes J, McElwee J, Butrick M, Matthews H, Price S, Biancalana M, Wang X, Richards M, Pozos T, et al. Heterozygous splice mutation in PIK3R1 causes human immunodeficiency with lymphoproliferation due to dominant activation of PI3K. J Exp Med. 2014; 211:2537–47. https://doi.org/10.1084/jem.20141759 [PubMed]
- 23. Wang S, Blazer DG. Depression and cognition in the elderly. Annu Rev Clin Psychol. 2015; 11:331–60. https://doi.org/10.1146/annurev-clinpsy-032814-112828 [PubMed]
- 24. Maggio M, Guralnik JM, Longo DL, Ferrucci L. Interleukin-6 in aging and chronic disease: a magnificent pathway. J Gerontol A Biol Sci Med Sci. 2006; 61:575–84. https://doi.org/10.1093/gerona/61.6.575 [PubMed]
- 25. Honda H, Terada S, Sato S, Oshima E, Ikeda C, Nagao S, Yokota O, Uchitomi Y. Subjective depressive mood and regional cerebral blood flow in mild Alzheimer’s disease. Int Psychogeriatr. 2014; 26:817–23. https://doi.org/10.1017/S1041610213002573 [PubMed]
- 26. Zhao H, He J, Yi J, Yao S. Factor Structure and Measurement Invariance Across Gender Groups of the 15-Item Geriatric Depression Scale Among Chinese Elders. Front Psychol. 2019; 10:1360. https://doi.org/10.3389/fpsyg.2019.01360 [PubMed]
- 27. Thomas-Antérion C, Honoré-Masson S, Laurent B. The cognitive complaint interview (CCI). Psychogeriatrics. 2006; 6:S18–22. https://doi.org/10.1111/j.1479-8301.2006.00129.x
- 28. Gifford KA, Liu D, Lu Z, Tripodis Y, Cantwell NG, Palmisano J, Kowall N, Jefferson AL. The source of cognitive complaints predicts diagnostic conversion differentially among nondemented older adults. Alzheimers Dement. 2014; 10:319–27. https://doi.org/10.1016/j.jalz.2013.02.007 [PubMed]
- 29. O’Donovan A, Pantell MS, Puterman E, Dhabhar FS, Blackburn EH, Yaffe K, Cawthon RM, Opresko PL, Hsueh WC, Satterfield S, Newman AB, Ayonayon HN, Rubin SM, et al, and Health Aging and Body Composition Study. Cumulative inflammatory load is associated with short leukocyte telomere length in the Health, Aging and Body Composition Study. PLoS One. 2011; 6:e19687. https://doi.org/10.1371/journal.pone.0019687 [PubMed]
- 30. Weaver JD, Huang MH, Albert M, Harris T, Rowe JW, Seeman TE. Interleukin-6 and risk of cognitive decline: MacArthur studies of successful aging. Neurology. 2002; 59:371–8. https://doi.org/10.1212/wnl.59.3.371 [PubMed]
- 31. Squassina A, Pisanu C, Vanni R. Mood Disorders, Accelerated Aging, and Inflammation: Is the Link Hidden in Telomeres? Cells. 2019; 8:52. https://doi.org/10.3390/cells8010052 [PubMed]
- 32. Leibel DK, Shaked D, Beatty Moody DLB, Liu HB, Weng NP, Evans MK, Zonderman AB, Waldstein SR. Telomere length and cognitive function: Differential patterns across sociodemographic groups. Neuropsychology. 2020; 34:186–98. https://doi.org/10.1037/neu0000601 [PubMed]
- 33. Köhler CA, Freitas TH, Maes M, de Andrade NQ, Liu CS, Fernandes BS, Stubbs B, Solmi M, Veronese N, Herrmann N, Raison CL, Miller BJ, Lanctôt KL, Carvalho AF. Peripheral cytokine and chemokine alterations in depression: a meta-analysis of 82 studies. Acta Psychiatr Scand. 2017; 135:373–87. https://doi.org/10.1111/acps.12698 [PubMed]
- 34. Betteridge DJ. What is oxidative stress? Metabolism. 2000; 49:3–8. https://doi.org/10.1016/s0026-0495(00)80077-3 [PubMed]
- 35. von Zglinicki T. Oxidative stress shortens telomeres. Trends Biochem Sci. 2002; 27:339–44. https://doi.org/10.1016/s0968-0004(02)02110-2 [PubMed]
- 36. Linghui D, Shi Q, Chi C, Xiaolei L, Lixing Z, Zhiliang Z, Birong D. The Association Between Leukocyte Telomere Length and Cognitive Performance Among the American Elderly. Front Aging Neurosci. 2020; 12:527658. https://doi.org/10.3389/fnagi.2020.527658 [PubMed]
- 37. Szebeni A, Szebeni K, DiPeri T, Chandley MJ, Crawford JD, Stockmeier CA, Ordway GA. Shortened telomere length in white matter oligodendrocytes in major depression: potential role of oxidative stress. Int J Neuropsychopharmacol. 2014; 17:1579–89. https://doi.org/10.1017/S1461145714000698 [PubMed]
- 38. Crawford B, Craig Z, Mansell G, White I, Smith A, Spaull S, Imm J, Hannon E, Wood A, Yaghootkar H, Ji Y, Mullins N, Lewis CM, et al, and Major Depressive Disorder Working Group of the Psychiatric Genomics Consortium. DNA methylation and inflammation marker profiles associated with a history of depression. Hum Mol Genet. 2018; 27:2840–50. https://doi.org/10.1093/hmg/ddy199 [PubMed]
- 39. Chin J, Park J, Yang SJ, Yeom J, Ahn Y, Baek MJ, Ryu HJ, Lee BH, Han NE, Ryu KH, Kang Y. Re-standardization of the Korean-Instrumental Activities of Daily Living (K-IADL): Clinical Usefulness for Various Neurodegenerative Diseases. Dement Neurocogn Disord. 2018; 17:11–22. https://doi.org/10.12779/dnd.2018.17.1.11 [PubMed]
- 40. Choi SH, Shim YS, Ryu SH, Ryu HJ, Lee DW, Lee JY, Jeong JH, Han SH. Validation of the Literacy Independent Cognitive Assessment. Int Psychogeriatr. 2011; 23:593–601. https://doi.org/10.1017/S1041610210001626 [PubMed]
- 41. Lee EH, Han MH, Ha J, Park HH, Koh SH, Choi SH, Lee JH. Relationship between telomere shortening and age in Korean individuals with mild cognitive impairment and Alzheimer’s disease compared to that in healthy controls. Aging (Albany NY). 2020; 13:2089–100. https://doi.org/10.18632/aging.202206 [PubMed]
- 42. Bae JN, Cho MJ. Development of the Korean version of the Geriatric Depression Scale and its short form among elderly psychiatric patients. J Psychosom Res. 2004; 57:297–305. https://doi.org/10.1016/j.jpsychores.2004.01.004 [PubMed]
- 43. Han C, Jo SA, Jo I, Kim E, Park MH, Kang Y. An adaptation of the Korean mini-mental state examination (K-MMSE) in elderly Koreans: demographic influence and population-based norms (the AGE study). Arch Gerontol Geriatr. 2008. https://doi.org/10.1016/j.archger.2007.08.012 [PubMed]
- 44. Choi SH, Lee BH, Kim S, Hahm DS, Jeong JH, Yoon SJ, Jeong Y, Ha CK, Nab DL. Interchanging scores between clinical dementia rating scale and global deterioration scale. Alzheimer Dis Assoc Disord. 2003. https://doi.org/10.1097/00002093-200304000-00008 [PubMed]
- 45. Shin HY. [A preliminary study on the Korean version of quality of life-Alzheimer’s disease (QOL-AD) scale in community-dwelling elderly with dementia]. J Prev Med Public Health. 2006; 39:243–8. [PubMed]
- 46. Chung MJ, Tong-Kyung K, Kim HY, Kang MH, Lee JS, Chung HR, Kwon S, Hwang JY, Choi YS. KoreaMed Synapse. J Nutr Health. The Korean Nutrition Society. 2018; 51:87–102. https://doi.org/10.4163/jnh.2018.51.1.87
- 47. Vellas B, Guigoz Y, Garry PJ, Nourhashemi F, Bennahum D, Lauque S, Albarede JL. The Mini Nutritional Assessment (MNA) and its use in grading the nutritional state of elderly patients. Nutrition. 1999; 15:116–22. https://doi.org/10.1016/s0899-9007(98)00171-3 [PubMed]