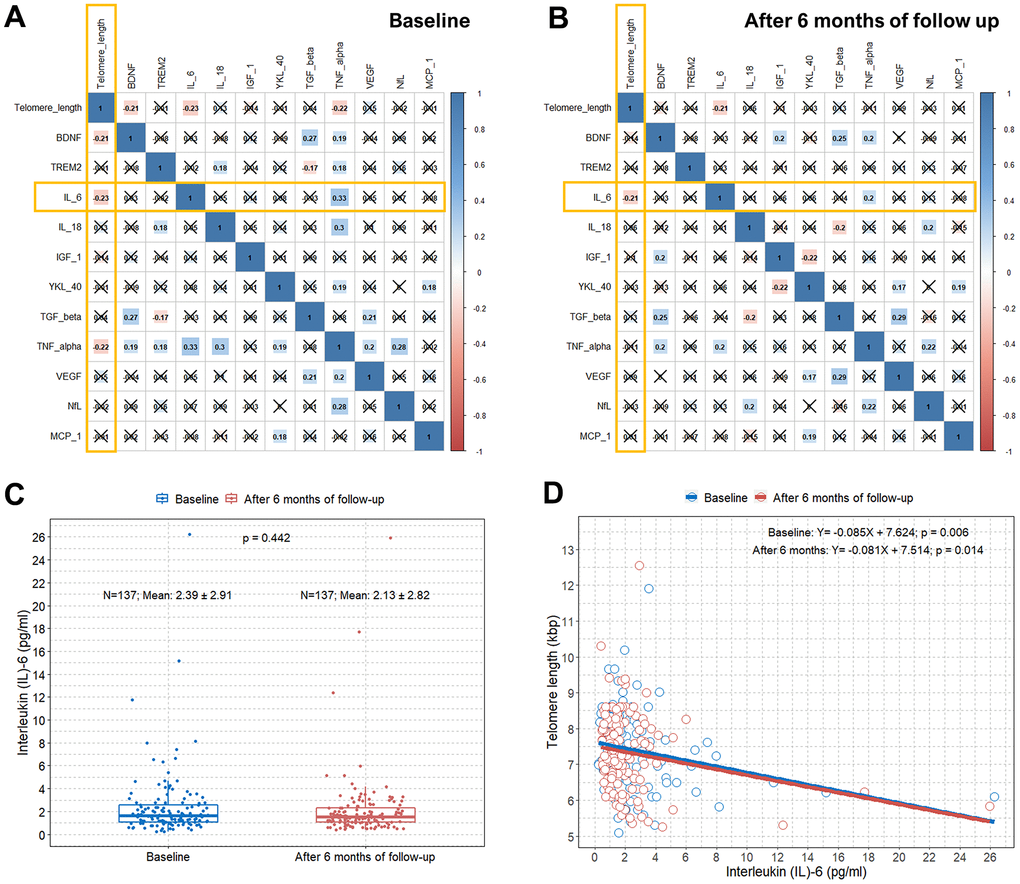
Figure 3.Correlation plots between TL and concentrations of several blood biomarkers and associations between TL and serum IL-6 levels. (A) Pearson correlation coefficients and significance levels were calculated between TL and concentrations of several blood biomarkers at baseline. The color-coordinated legend indicates the value and sign of Pearson’s correlation coefficient. The number in the box indicates Pearson’s correlation coefficient. Moreover, an x in the box indicates a p-value≥0.005; (B) Pearson correlation coefficients and significance levels were calculated between TL and concentrations of several blood biomarkers after six months of follow-up. The color-coordinated legend indicates the value and sign of Pearson’s correlation coefficient. The number in the box indicates Pearson’s correlation coefficient. Moreover, an x in the box indicates a p-value≥0.005; (C) Boxplot showing distributions of IL-6 levels in the study subjects at baseline and after six months of follow-up; (D) scatterplot with a linear regression line showing the association between IL-6 and TL at baseline and after six months of follow-up. TL=telomere length; IL-6= interleukin-6.