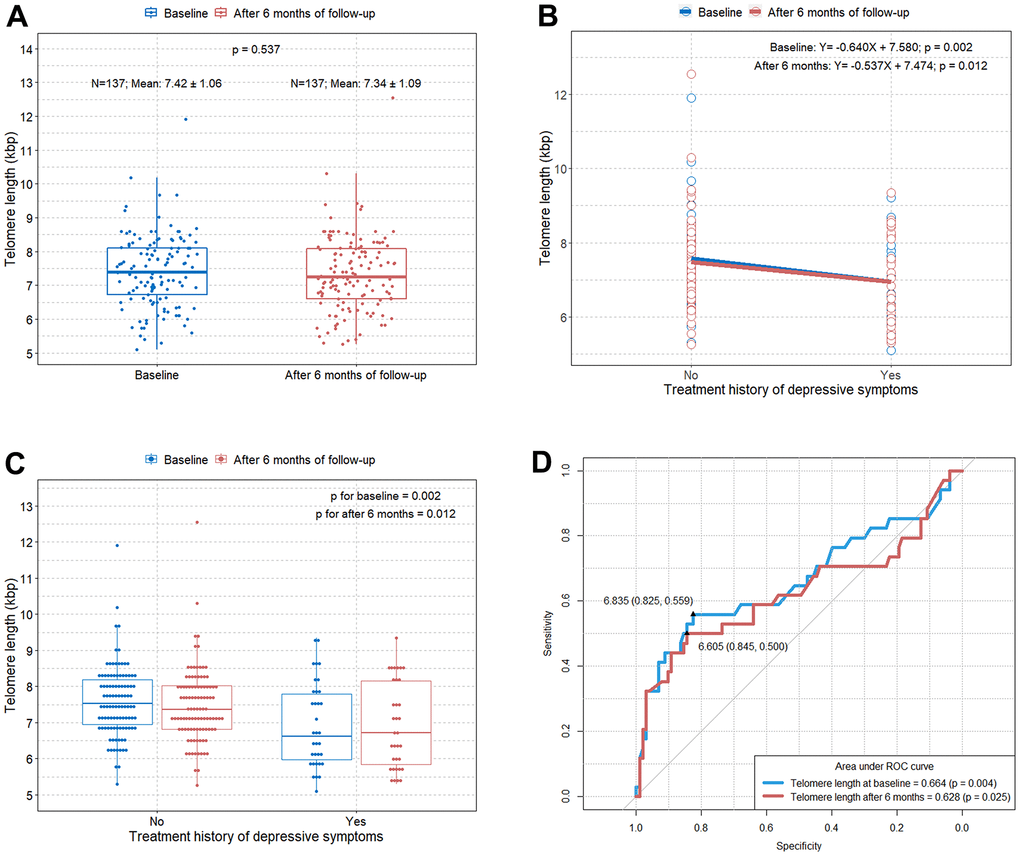
Figure 1.Comparison of TL according to the treatment history for depressive symptoms at baseline and after six months of follow-up. (A) Boxplot showing distributions of TLs in the study subjects at baseline and after six months of follow-up; (B) scatterplot with a linear regression line showing the difference in TL according to the treatment history for depressive symptoms at baseline and after six months of follow-up; (C) boxplot showing differences in TL according to the treatment history for depressive symptoms at baseline and after six months of follow-up; (D) ROC curve to identify the optimal cut-off values predicting depressive symptoms requiring treatment in elderly at baseline and after six months of follow-up. TL=telomere length; ROC=receiver operating characteristic.