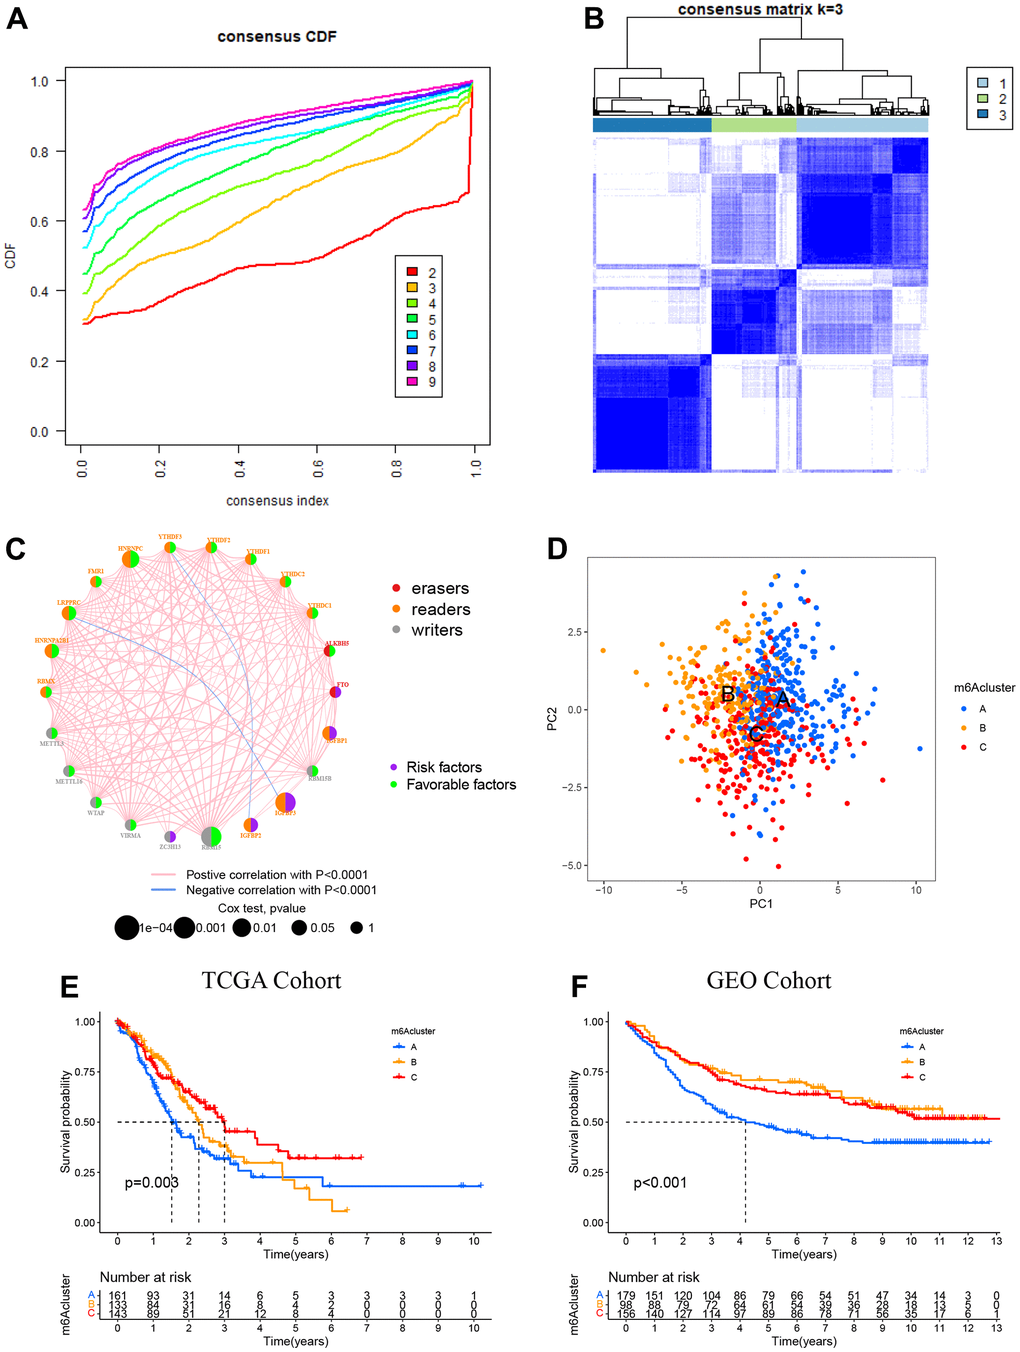
Figure 3.Patterns of m6A methylation modification. (A) CDF (cumulative distribution function; k = 2–9) in the right panel. (B) Depending on the consensus clustering matrix (k = 3), the patients with STAD were classified into three clusters. (C) Interactions among 22 m6A regulators in STAD. Circles in varying colors were used to represent differing RNA modifications, where red indicated Erasers, orange indicated readers, and gray indicated writers. Besides, green and purple circles, respectively, referred to the favorable and risky factors. (D) PCA (principal component analysis)-based map depicting prominent differences among the three m6A clusters. (E) Kaplan–Meier OS (overall survival) plots of 3 m6A clusters for the TCGA cohort (p = 0.003). (F) Kaplan–Meier OS plots of three m6A clusters for the GEO cohort (p < 0.001). OS was worse among those in the m6A cluster C as compared to the other 2 clusters.