


Introduction
Stomach adenocarcinoma (STAD) is one of the most common pathological types of gastric cancer, the sixth most normal malignancy worldwide, and the fourth major reason for tumor-related deaths [1]. Despite obvious development in the diagnosis and treatment for STAD, the prognosis for patients with STAD remains poor due to postoperative recurrences and advanced stages [2, 3]. Thus, identifying novel effective biomarkers for early detection and therapeutic targets for patients with STAD is crucial.
Several studies indicate that N6-methyladenosine (m6A) plays an essential role in tumorigenesis and the development of various cancers, including STAD [4, 5]. As a dynamic process, m6A RNA modification is primarily regulated via adenosine methyltransferases (“writers”) and demethylases (“erasers”) and performs specific functions through interacting with m6A binding proteins (“readers”). m6A is widely distributed in various RNAs, such as messenger RNA (mRNA), pre-microRNA (pri-miRNA), circular RNA (circRNA), and lncRNA. Moreover, m6A is associated with tumorigenesis and development, including STAD [6–8]. For example, the m6A writer METTL3-catalyzed m6A modification was found to stimulate the expression of NOTCH1 and activate the Notch signaling pathway in esophageal squamous cell carcinoma [9]. METTL3 might stimulate m6A modification of HDGF expression, and the m6A reader IGF2BP3 could increase its stability, which recognizes and binds to the m6A site to promote tumor angiogenesis and glycolysis in STAD [10]. Furthermore, previous literature proved that m6A plays a critical role in the tumor microenvironment (TME), immune recognition, and immune response [11–13].
Recently, although increasing evidence indicates a correlation between m6A modification and immune cell infiltration, the cancer-related pathways of m6A methylation in tumor immune microenvironment (TIME) are still little understood. According to Han et al., lysosomal proteases labeled and identified by YTHDF1 can trigger the degradation of tumor neoantigens [14]. Moreover, they found higher expression levels of NK cells and CD8+ cytotoxic T cells in the tumors of YTHDF1 knockout mice than WT mice, suggesting a stronger anti-tumor response when YTHDF1 is present. Chong et al. pointed out that interferon-gamma (IFN-γ)-induced cytotoxicity in melanoma cells was capable of degrading through FTO in vitro by lowering the levels of cell-intrinsic genes PD-1, SOX10, and CXCR4 expression which through YTHDF2-mediated decay [15]. However, due to technical limitations, almost all research has focused on one or two m6A regulators. Therefore, a comprehensive investigation of multiple m6A regulators in STAD, including the associations between m6A regulators and CNVs and TMBs, as well as the prognostic value and the risk score in immunotherapy and chemotherapy, will provide a more comprehensive understanding of the TIME.
In this study, we screened the Cancer Genome Atlas (TCGA) database for m6A-related genes associated with STAD, thereby assessing the correlation between m6A methylation and prognosis, CNVs, TMB, and TIME of STAD. Subsequently, we identified three clustering subtypes through the “Consensus Cluster Plus” method, and the above three subtypes were closely related to the following three phenotypes, respectively, immune-inflamed, immune excluded, and immune-desert [16]. Afterward, a scoring model, m6A score, was constructed to quantify STAD of individual samples. This study explored the correlations between carcinogenic pathways and ICI treatment, scoring model, and TIME to discover the influence of m6A regulators in STAD. Herein, it is demonstrated that m6A regulators play an indispensable role in TIME and contribute to making therapeutic strategies on STAD.
Materials and Methods
The collection and pretreatment of datasets and samples
In this study, the genomics data and clinical information of STAD patients were obtained from the public TCGA database (https://cancergenome.nih.gov/), containing 350 tumor samples and 32 normal samples. The selection criteria were applied as 1) Complete clinical and OS information, including gender, age, stage, and radiation therapy, were collected for the investigation. 2) Histologically confirmed STAD. The UCSC Xena (https://gdc.xenahubs.net/) obtains mutation data. Twenty-three m6A regulators were gained as per previous research (Supplementary Table 1). The number of nonsynonymous and synonymous mutations was stated as the tumor mutation burden. The GSE84437 (N = 433) from Gene Expression Omnibus (GEO https://www.ncbi.nlm.nih.gov/geo/) datasets were used as the validation cohort (Table 1).
Table 1. Comparison of clinical-pathological characteristics between TCGA-STAD cohort and GSE84437 cohort.
| TCGA-STAD cohort n=350 | GSE84437 cohort n=433 | P | |
| Age, median [min, max] | 67.0 [35.0, 90.0] | 62.0 [27.0, 86.0] | 0.002 |
| ≤60 | 117(33.4%) | 194(44.8%) | |
| >60 | 230(65.7%) | 239(55.2%) | |
| Unknown | 3(0.8%) | 0(0) | |
| Gender (n, %) | 0.263 | ||
| Male | 226(64.6%) | 296(68.4%) | |
| Female | 124(35.4%) | 137(31.6%) | |
| OS Status (n, %) | 0.061 | ||
| Alive | 204(58.3%) | 224(51.7%) | |
| Dead | 145(41.4%) | 209(48.2%) | |
| Unknown | 1(0.3%) | 0(0) | |
| OS time (months), median [min, max] | 15.8 [0.03, 124] | 70.0 [1.00, 161] | <0.001 |
| T (n, %) | |||
| T1 | 16(4.6%) | 11(2.5%) | |
| T2 | 74(21.1%) | 38(8.8%) | |
| T3 | 161(46.0%) | 92(21.2%) | |
| T4 | 95(27.1%) | 292(67.4%) | |
| Unknown | 4(1.1%) | 0(0) | |
| N (n, %) | <0.001 | ||
| N0 | 103(29.4%) | 80(18.5%) | |
| N1 | 93(26.6%) | 188(43.4%) | |
| N2 | 72(20.6%) | 132(30.5%) | |
| N3 | 71(20.3%) | 33(7.6%) | |
| Unknown | 11(3.1%) | 0(0) | |
| M (n, %) | - | ||
| M0 | 312(89.1%) | NA | |
| M1 | 23(6.6%) | NA | |
| Unknown | 15(4.3%) | NA | |
| TNM stage (n, %) | - | ||
| I | 46(13.1%) | NA | |
| II | 110(31.4%) | NA | |
| III | 145(41.4%) | NA | |
| IV | 35(10.0%) | NA | |
| Unknown | 14(4.0%) | NA | |
| Tumor Grade (n, %) | - | ||
| G1 | 9(2.6%) | NA | |
| G2 | 125(35.7%) | NA | |
| G3 | 207(59.1%) | NA | |
| Unknown | 9(2.6%) | NA | |
The consensus clustering of 23 m6A regulators by consensus cluster plus
We employed the Consensus Cluster Plus R package to elucidate the biological role of m6A regulators in STAD categorize patients into different m6A isoforms [17]. “PCA” package was used to analyze gene expression among distinct m6A subtypes.
Gene set variation analysis (GSVA)
The biological processes among disparate m6A subtypes were studied using the GSVA package [18]. We used the MSigDB and IMvigor210 CoreBiologies packages to enrich well-defined biological pathways and roles [19, 20]. The Gene Ontology (GO) annotation of m6A-related genes was carried out using the “ClusterProfiler” package [21].
Immune response analysis
Based on the immunophenoscore (IPS) of 415 STAD patients, we created the Cancer Immunome Database (TCIA) (https://www.tcia.at/home), which could provide a comprehensive analysis of immunogenomic data. Furthermore, this study employed the Tumor Immune Dysfunction and Exclusion (TIDE) method to predict immune checkpoint blockade (ICB) response and tumor immune evasion mechanisms. The ESTIMATE package was used to assess tumor purity and tumor cellularity based on expression matrixes composed of the TIME. In addition, the summation of the immune and stromal scores from each sample was defined as the tumor purity. According to the tumor sample, which contains lower tumor purity and higher immune scores, an abundance of immune cells may have infiltrated the tumor.
DEGs associated among the m6A phenotypes
According to the consensus clustering algorithm, patients were divided into three m6A clusters and identified as differentially expressed genes (DEGs). The “limma” package was used to verify DEGs among three m6A clusters [22]. The screening criteria were well-defined as p-value <0.01.
Evaluation of the m6A gene signature
The intersected DEGs were derived from the univariate Cox regression. The number of gene clusters was then determined by adopting the consensus clustering algorithm. The prognosis-related genes were discovered to construct Principal Component Analysis (PCA) and extracted the m6A score [23, 24]. The advantage of this algorithm is that it focuses mainly on negatively (or positively) correlated genes. The m6A score formula is as follows:
Lastly, the correlation between m6A score and TMB was performed via Spearman’s approach according to survival curve and synonymous and nonsynonymous mutation counts.
Biological pathways with m6A score
There is evidence that a panel of signatures associated with distinct biological pathways, including: 1) epithelial mesenchymal transition (EMT); 2) immune-checkpoint; 3) pan-fibroblast TGFb response signature; 4) CD8 T-effector signature; 5) homologous recombination; 6) Fanconi anemia pathway; 7) WNT target; 8) base excision repair; 9) mismatch repair; 10) DNA damage repair; 11) DNA replication; 12) nucleotide excision repair; 13) cell cycle regulation; 14) antigen processing; 15) cell cycle and 16) FGFR3-related genes [20, 25].
The immune-checkpoint cohorts analysis
Three independent anti-PD-L1 cohorts that could apply to genomic and clinical information were acquired from the IMvigor210 cohort [20] and GSE78220 cohort [26] to calculate the predictive value of the m6A score for immunotherapy.
Evaluation of the sensitivity of chemotherapeutic drugs
Genomics of Drug Sensitivity in Cancer (GDSC) is the largest public pharmacogenomics database that could predict sensitivity between high and low m6A score subtypes [27]. The pRRophetic package could process the half-maximal inhibitory concentration (IC50) via the ridge regression model [28].
Immunohistochemistry (IHC)
IHC experiment detected IRGs protein levels in STAD and corresponding normal tissues. First, each sample was subjected to 10% formalin fixation, paraffin embedding, and processing up to 4-μm consecutive sections. After that, the sections were treated with methanol, followed by BSA incubation and primary antibody staining. Then, we stained the samples with a secondary antibody after washing with PBS. Finally, each section was observed and photographed using a microscope. The primary antibodies were obtained from Abcam.
Statistical analyses
R software (version 3.6.3) was applied for this study. Wilcoxon test was computed using the difference comparison of the DEGs between high and low m6A score groups. Association between tumor-infiltrating immune cells and m6A score was applied for Spearman’s correlation. Kaplan-Meier methods were visualized for the difference in overall survival (OS) between the high-risk and low-groups. In addition, the screening criterion was p-value <0.01.
Data availability statement
Publicly available datasets were analyzed in this study. The datasets generated during the current study are available in the Cancer Genome Atlas (TCGA) public dataset (https://portal.gdc.cancer.gov/) and the Gene-Expression Omnibus (GEO) public dataset (https://www.ncbi.nlm.nih.gov/geo/).
Results
Genetic expression of 23 m6A regulators in STAD
Figure 1 shows the flow chart of this study. The TCGA dataset identified 23 m6A regulators (eleven “readers,” eight “writers,” and two “erasers”), which were summarized the biological functions and processes via the Metascape database (Figure 2A). Figure 2B shows the prevalent deletions of m6A regulators in copy number, while VIRMA, YTHDF1, and FMR1 featured an overall frequency of CNV amplification. Subsequently, as per Figure 2C, the location of CNV of all m6A regulators was listed in the chromosomes. Figure 2D shows that ZC3H13 showed the highest mutation frequency (8%), followed by RBM15B and YTHDC1, whereas VIRMA, METTL16, ALKBH5, FTO, and METTL3 did not display any mutations. Based on our analysis of the most mutated ZC3H13, nine of the other 22 m6a regulators are of interest (Supplementary Figure 1). Further investigation demonstrated that the expression of most m6a genes was significantly up-regulated in tumor samples except IGFBP2 (Figure 2E). m6A regulators (like VIRMA, YTHDF1, FMR1, and ZC3H13) with amplificated CNV showed higher expression than normal tissues. (Figure 2B, 2E). Following the obtained findings, we could demonstrate that m6A regulators exhibited significant transcriptome-altering landscapes and heterogeneity in genomics between STAD and normal samples.
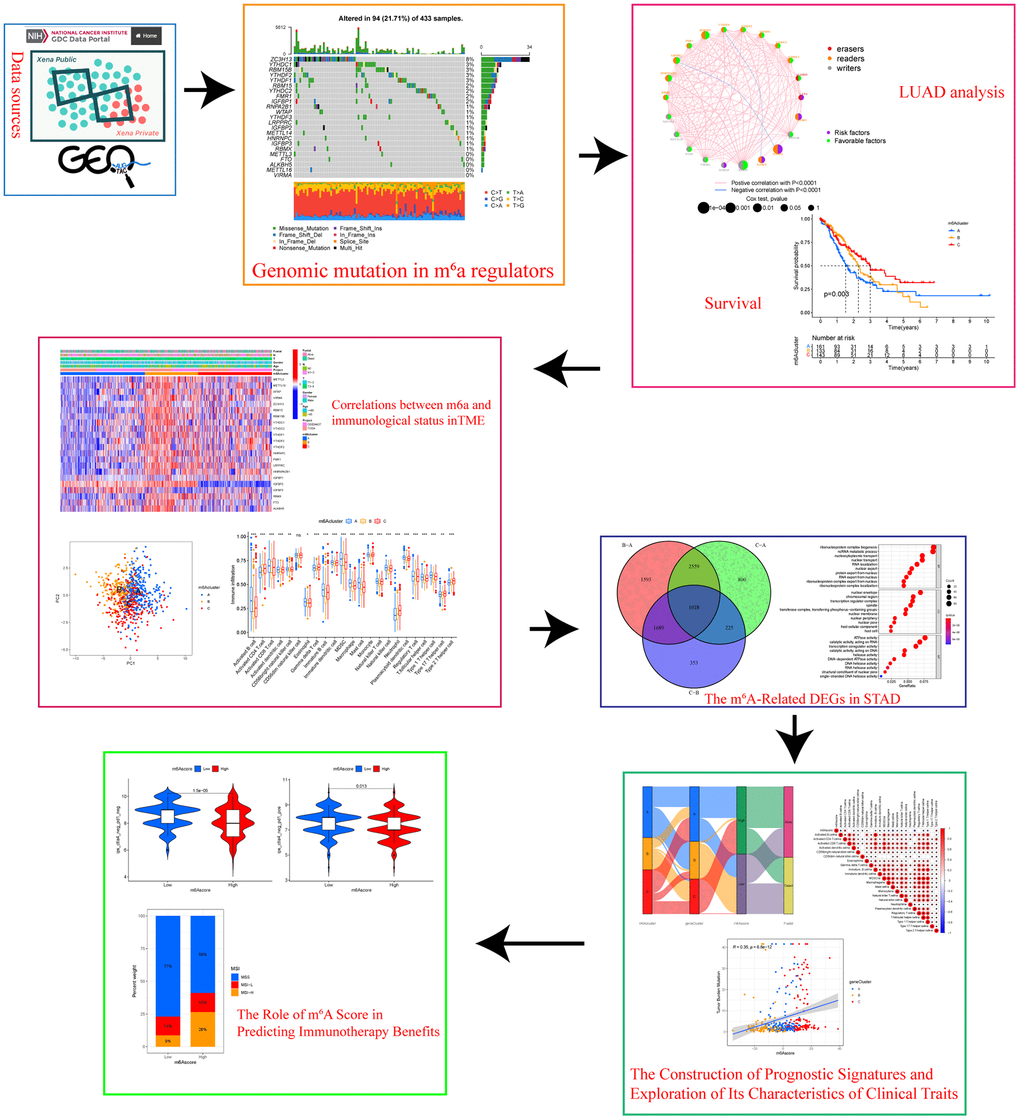
Figure 1. Research flow chart.
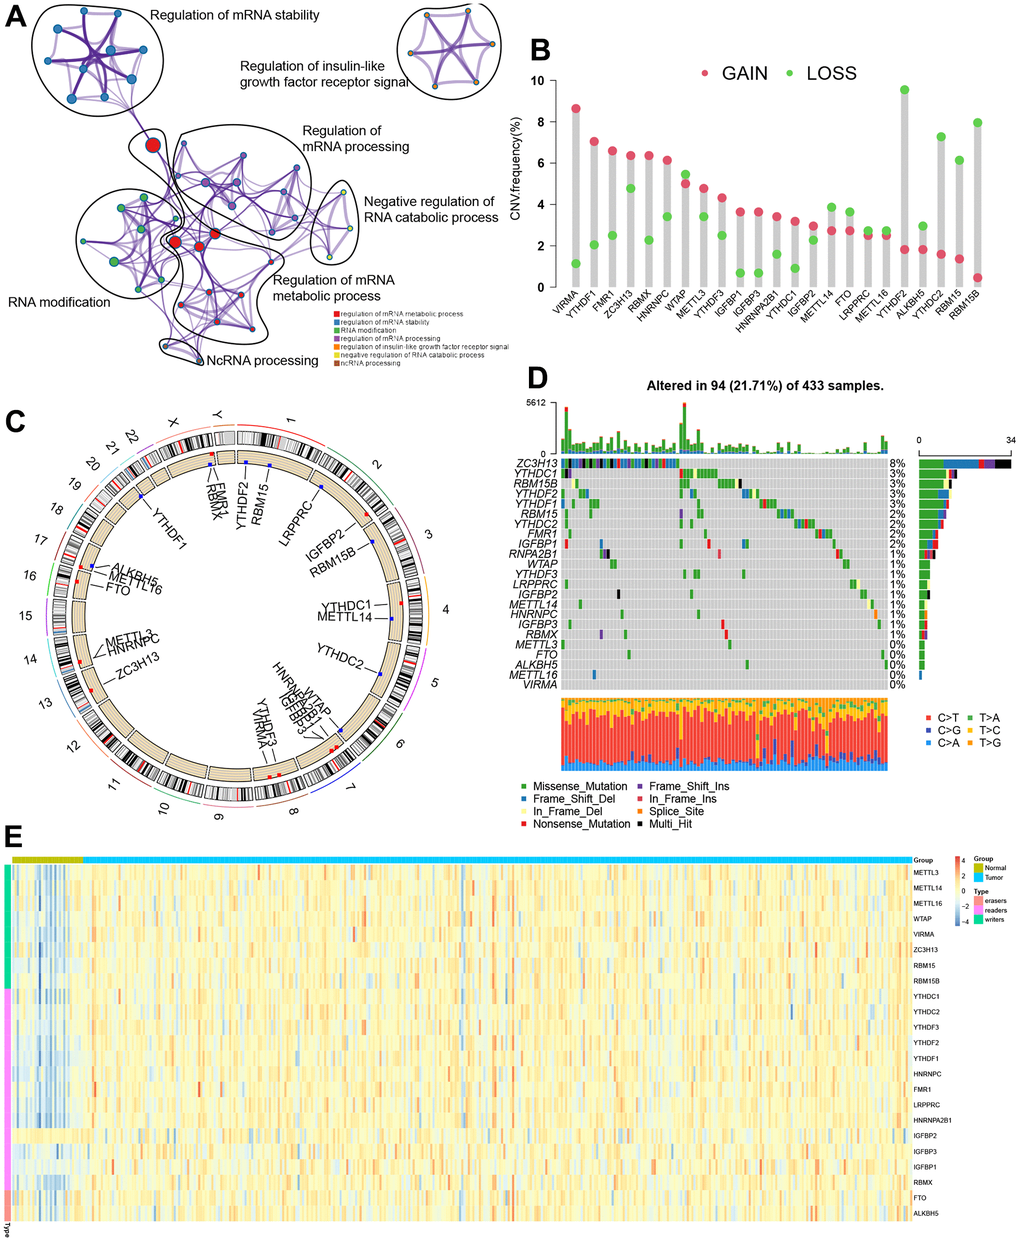
Figure 2. Genetic topography of the 23 m6A regulators in STAD. (A) Metascape network of 23 functionally enriched m6A regulators. Annotations denoted by different circles varied. (B) CNV map for 23 m6A regulators, where the column stood for the alteration frequency, and the green and pink dots, respectively, indicated the deletion and amplification of CNV. (C) CNV alteration sites for the cellular m6A regulators. (D) Among 433 patients, varying genetic alterations were noted in 94 patients, such as missense, nonsense, and splice-site mutations. (E) The different expression levels of 23 m6A regulators between normal and STAD.
Identification of m6A subgroups mediated via 23 m6A regulators
The TCGA-STAD dataset with available clinical and survival information was enrolled into the training cohort. By applying the R package “Consensus ClusterPlus”, 350 STAD patients were stratified into three distinct following the expression of 23 m6A genes (Figure 3A, 3B, and Supplementary Figure 2). Variable selection was performed by LASSO Cox regression and the parameter λ indicated that the most suitable model to predict survival included RBM15, IGFBP1, RBMX, FTO, and ALKBH5 with coefficients of -0.306, 0.125, 0.042, 0.543, and -0.293, respectively (Supplementary Figure 3). The regulator network comprehensively represented the prognostic significance of 23 m6A regulators and their whole interactions (Figure 3C, and Supplementary Figure 4). FTO was found to be a risk factor and a favorable factor for ALKBHS in the eraser gene, and all other writers, except for IGFBP2 and IGFBP3 genes, were also favorable. In addition, we found that the 23 m6A regulators are positively correlated except for IGFBP2 and IGFBP3. Based on these results, the crosstalk among the 23 m6A regulators might play a key role in the pathogenesis and progression of individual tumors and in the formation of distinct m6A modifications. Thus, unsupervised clustering was adopted to classify samples into distinct m6A clusters. Furthermore, we could distinguish one m6A cluster from others completely in line with PCA (Figure 3D). Accordingly, three distinct m6A clusters were ultimately detected in the TCGA dataset, containing 161 in m6A cluster A, 133 in m6A cluster B, and 143 in m6A cluster C (Figure 3E). Among the above clusters, m6A cluster A, m6A cluster B, and m6A cluster C, m6A cluster A showed poor prognosis in the TCGA cohort, whereas patients in the m6A cluster C had an advantage in overall survival (p = 0.003). Similar results could also be found in the validation cohort (GEO cohort (Figure 3F).
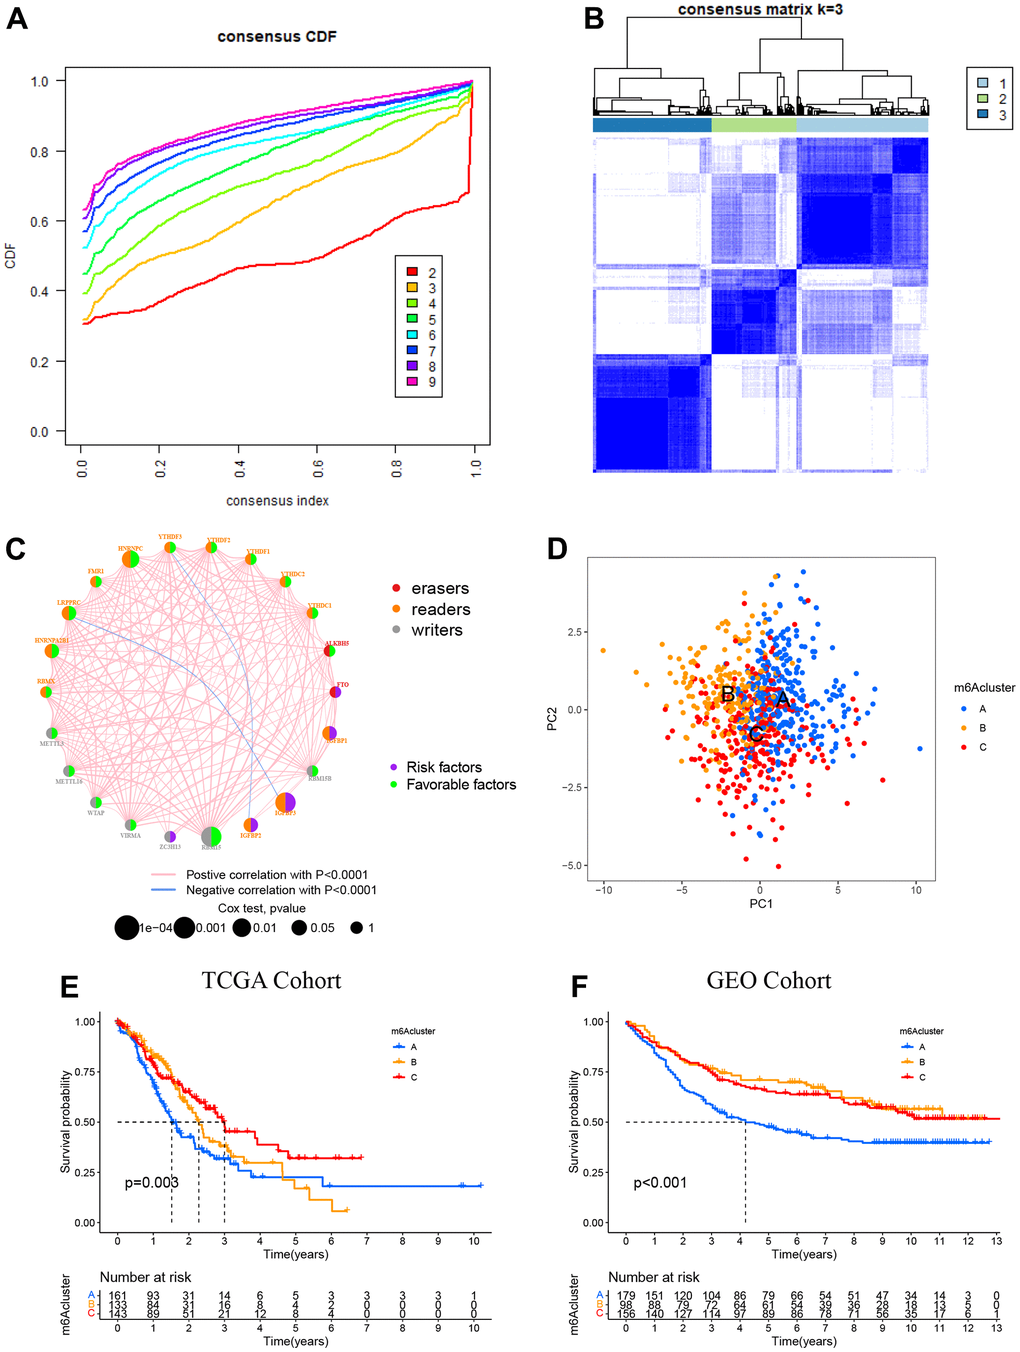
Figure 3. Patterns of m6A methylation modification. (A) CDF (cumulative distribution function; k = 2–9) in the right panel. (B) Depending on the consensus clustering matrix (k = 3), the patients with STAD were classified into three clusters. (C) Interactions among 22 m6A regulators in STAD. Circles in varying colors were used to represent differing RNA modifications, where red indicated Erasers, orange indicated readers, and gray indicated writers. Besides, green and purple circles, respectively, referred to the favorable and risky factors. (D) PCA (principal component analysis)-based map depicting prominent differences among the three m6A clusters. (E) Kaplan–Meier OS (overall survival) plots of 3 m6A clusters for the TCGA cohort (p = 0.003). (F) Kaplan–Meier OS plots of three m6A clusters for the GEO cohort (p < 0.001). OS was worse among those in the m6A cluster C as compared to the other 2 clusters.
The distinct immune landscapes of TIME in m6A clusters
We performed the heatmap and visualized the expression of 23 m6A regulators (Figure 4A) to investigate the correlation of these m6A clusters with clinical features. Most of the m6A regulators were up-expressed in cluster B, while IGFBP1 and IGFBP2 were down-regulated in cluster A. To our surprise, most people over 65 years significantly increased in cluster B. TIME and CIBERSORT package were applied to investigate the subsets of immune cells and feature the immune cell infiltration according to the expression file. Anti-tumor lymphocyte cells, like NK cells and activated CD8+ T cells, were primarily engaged in the m6A cluster A (Figure 4B). Cluster C was enriched with 2/17 T helper cells and gamma delta T cells. We demonstrated that m6A cluster A represented the highest immune scores, followed by m6A cluster C and m6A cluster B (Figure 4C). Accordingly, m6A cluster A displayed a higher tumor purity than m6A cluster C and m6A cluster B, suggesting that more stromal cells and immune cells surround tumors in m6A cluster C and B (Figure 4D). Previous studies had suggested a tumor stroma with multiple immune cells could retain these cells rather than the parenchyma of an immune-excluded phenotype.
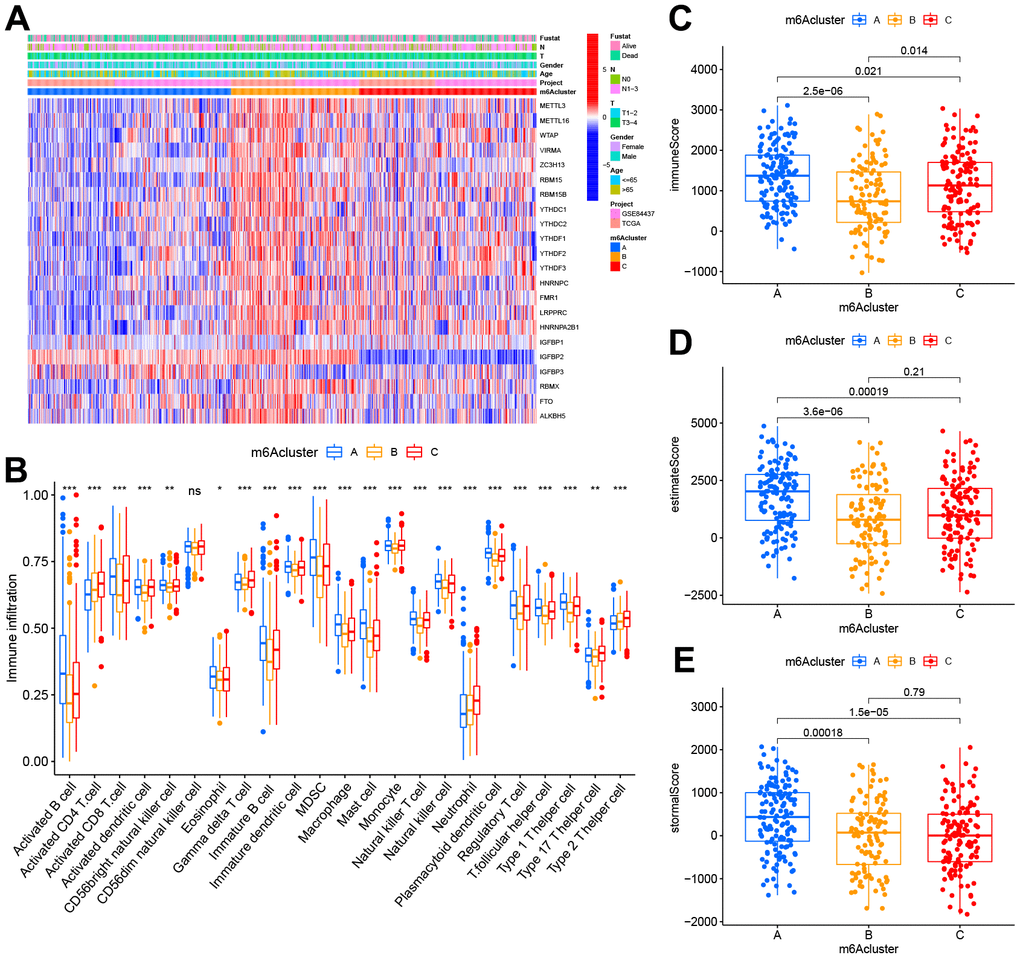
Figure 4. TIME properties in the three m6A clusters. (A) Thermogram depicting the consensus clustering outcome for the TCGA cohort, where age, gender, T&N stage, radiation, survival, and stage constituted the clinical traits. (B) CIBERSORT-based immunocyte infiltration in the three m6A clusters. *p < 0.05;**p < 0.01; ***p < 0.001. ns stood for no significance. (C–E) Assessment results of the (C) immune scores, (D) estimate scores, as well as (E) stromal scores across three m6A clusters.
The m6A-related DEGs in STAD
1018 DEGs were overlapped via the Venn diagram to identify the biological behaviors of these m6A clusters (e.g., expression perturbations and genetic alterations), and then, we examined transcriptional expression changes associated with three m6A clusters in STAD (Figure 5A). According to GO functional annotation, BPs associated with ribonucleoprotein complex biogenesis and RNA localization were significant bio-functions (Figure 5B). As per Figure 5C, three m6A gene clusters displayed distinct clinicopathological characteristics. Further, patients of late stages were mostly clustered into gene cluster C. Furthermore, all those three m6A gene clusters showed significantly different prognoses among the STAD samples based on survival analysis. Generally, samples of m6A cluster B had dismal prognostic outcomes, while those of m6A cluster C had superior prognostic outcomes (Figure 5D).
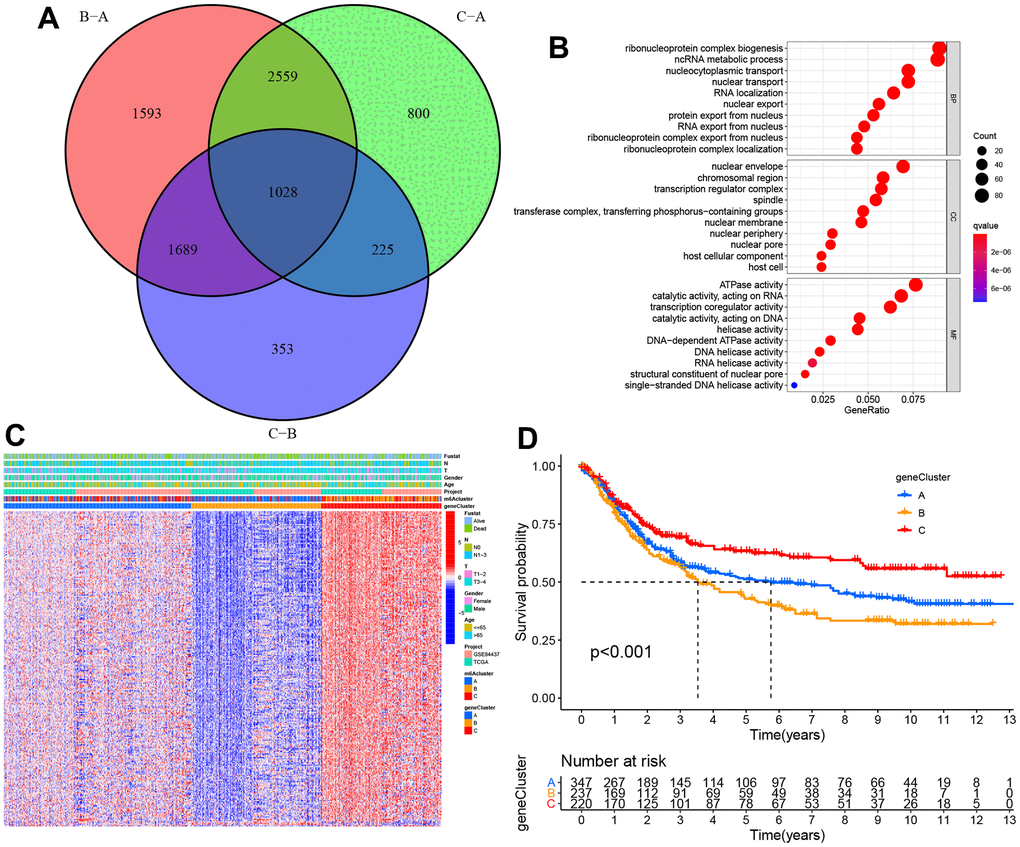
Figure 5. The construction of m6A gene clusters and relevant functional annotations. (A) Venn plot depicting 1,028 DEGs (differentially expressed genes) among three m6A clusters. (B) GO enrichment findings of 1,028 intersecting genes. (C) Intersect gene-based consensus clustering result of patients into three separate gene clusters. (D) Kaplan–Meier plots for the three m6A gene clusters (p < 0.001).
Prognostic signature establishment and clinical feature exploration
According to those findings above, m6A regulators have essential effects on modulating TIME and prognostic outcome. However, the above analysis is based on the general population alone, whereas the heterogeneous and complicated m6A regulators are not explained separately. Based on those discovered m6A genes, this work established one scoring system referred to as m6A score to quantify scores of different individuals using those discovered m6A genes.
The alluvial diagram represents quantitative alterations in STAD samples (Figure 6A). These findings indicated that m6A clusters A/C showed increased m6A scores, while cluster B showed decreased m6A scores. In addition, we performed Spearman’s correlation analysis to illustrate m6A regulator patterns. Based on the heatmap, the m6A score showed immature B cell and activated CD4 T cell (Figure 6B). Next, this study evaluated the m6A score’s significance as a prognosis predictor for patients. We divided patients as low-or high m6A score subgroups as per the threshold. As expected, high m6A score patients were related to significantly poorer outcomes (Figure 6C). In this study, we also analyzed the relationship between m6A score and PD-L1 expression; as a result, high m6A score patients had increased PD-L1 expression compared to low m6A score patients (Figure 6D). Increasing evidence has illustrated that TMB is related to immunotherapeutic response. Thus, this work analyzed TMB distribution between high and low m6A score patients. According to our results, low m6A score patients were related to a decreased TMB frequency (Figure 6E). As shown in Figure 6G, the m6A score showed a marked positive correlation with TMB (R = 0.35, p = 6.8e-12). Further, we also examined somatic mutation gene distributions between both subgroups. According to Figure 6F, patients with high m6A scores had more somatic mutations than those with low scores.
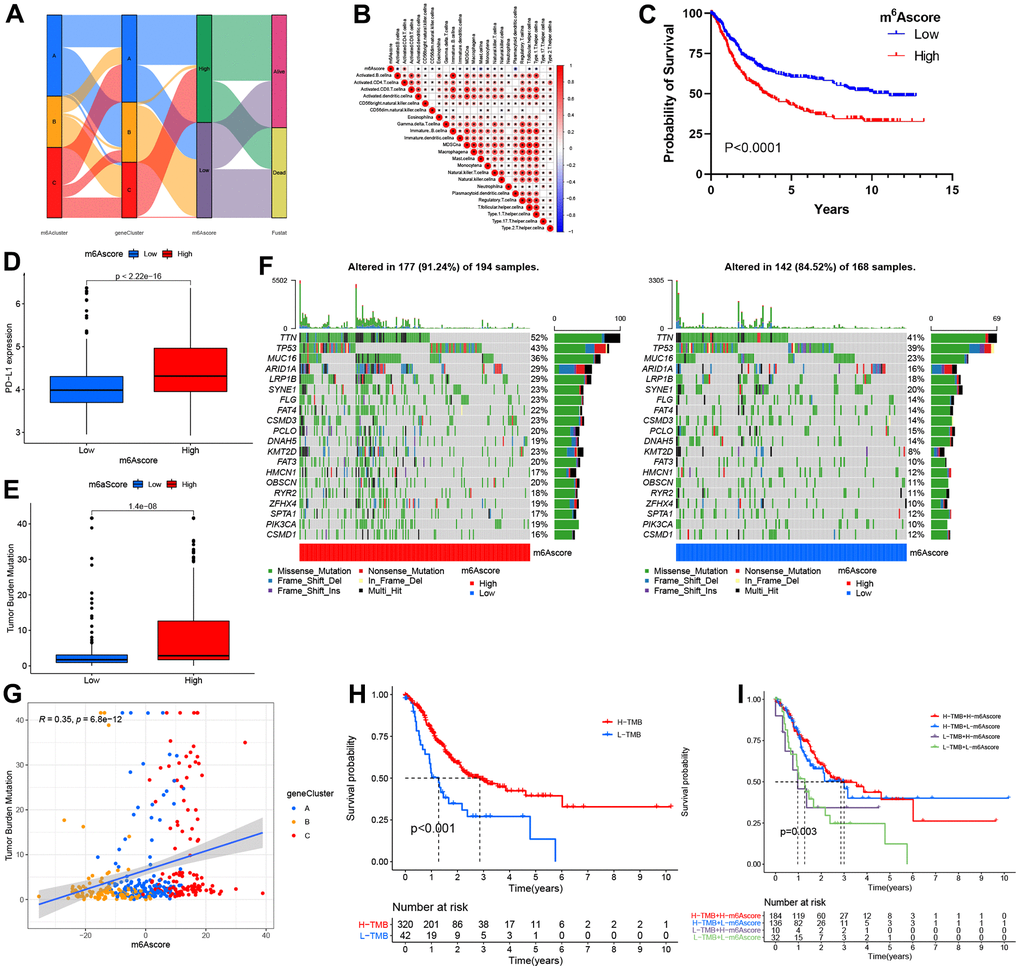
Figure 6. The m6A score construction and relevant genetic trait assessment. (A) Alluvial chart of m6A clusters regarding gene cluster and score of m6A, as well as patient survival. (B) Spearman correlations of m6A score with immunocytes. (C) Survival findings for the TCGA cohort patients marking high and low m6A scores. (D) PD-L1 level comparison between patients marking high and low m6A scores. (E) TMB (tumor mutation burden) distribution comparison between patients marking high and low m6A scores. (F) Mutational waterfall plot for the TCGA cohort patients marking high (left panel) and low (right panel) m6A scores. All patients were represented by individual columns. (G) Diagram illustrating significant positive association of m6A score with TMB (R = 0.35, p = 6.8–12). (H) Kaplan–Meier plots for patients exhibiting high (H) and low (L) TMBs. (P< 0.001). (I) Kaplan–Meier plots for the TCGA cohort patients stratified by both m6A score and TMB. H, high; L, Low; TMB, tumor mutation load (P = 0.003).
Additionally, cases with increased TMB frequency had survival benefits (p<0.001; Figure 6H), whereas those with high m6A scores did not exhibit any difference in survival advantage between high and low TMB frequency (Figure 6I). Therefore, cases with an increased TMB frequency possibly gained more survival benefits from radiotherapy than those with a decreased frequency.
This work also examined the m6A score’s prognostic significance under diverse clinical factors. As a result, low m6A score cases were associated with superior prognosis to low m6A score patients from the T-stage subgroup (Supplementary Figure 5). Besides, low m6A score cases possibly gained more advantages from signatures than high m6A score cases.
m6A score’s effect on estimating immunotherapeutic responses
This study examined differential expression of immune checkpoints (ICPs) to predict immunotherapeutic responses among STAD patients. IPS for the 140 TCIA- derived PAAD cases were identified as the favorable factor that predicted anti-cytotoxic T lymphocyte antigen-4 (CTLA-4) and anti-programmed cell death protein 1 (anti-PD-1) antibody responses, and it was significantly different between the two groups that they were both positive (Figure 7A–7D). Additionally, the other two immunotherapy cohorts, IMvigor210 cohort and GSE78220, were used to analyze the role of m6Acore in predicting anti-PD-L1 therapeutic response in patients. As for IMvigor210 and GSE78220 cohorts, patient survival did not consistently respond between low and high m6A score groups (Supplementary Figure 6). In conclusion, the results of this study suggest a close relationship between m6A regulators and TIME, which is responsible for immunotherapeutic responses.
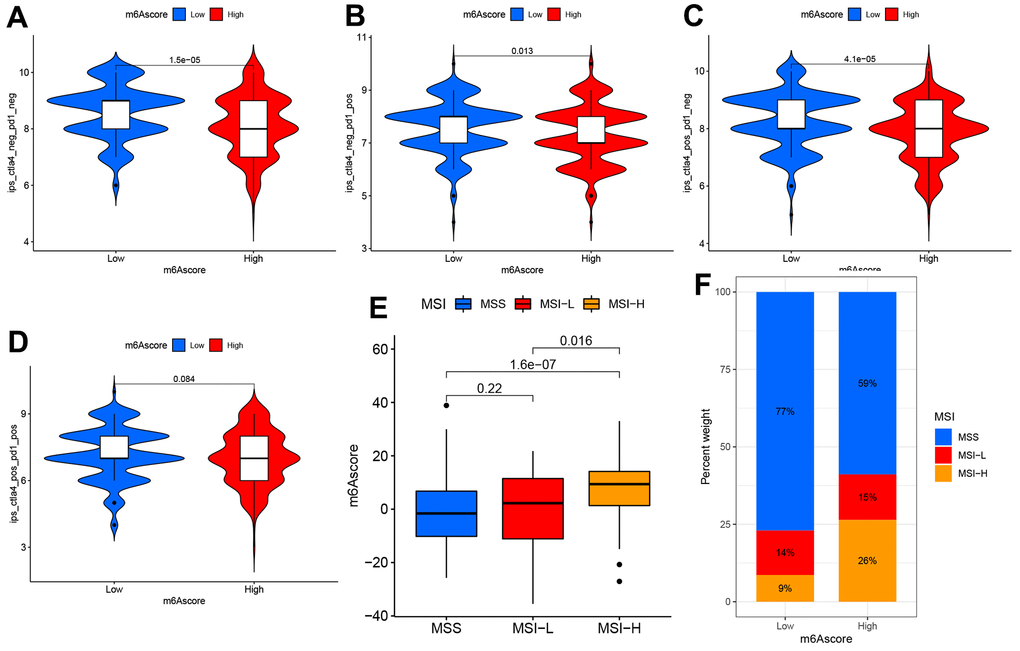
Figure 7. The m6A score predicts immunotherapeutic benefits. (A–D) TCIA database-based correlations of m6A score with IPS among the PAAD patients: (A) CTLA4(−) PD1(−) (B) CTLA4(−) PD1(+) (C) CTLA4(+) PD1(−) (D) CTLA4(+) PD1(+). (E) Distribution of m6A score in different MSI groups. (F) The ratio of MSI (microsatellite instability) in STAD samples with MSS and MSI-L and MSI-H.
External validation of five key prognostic m6A RNA modulators
IHC staining of five paired STAD and adjacent non-tumorous tissues was used to validate the protein expression of the five prognosis genes (Figure 8). The compared with adjacent non-tumorous tissues, we found a higher level of RBM15, IGFBP1, RBMX, FTO, and ALKBH5 in all five STAD tissues, RBM15, FTO and ALKBH5 were overexpressed in STAD tumor tissues, while the expression of IGFBP1, RBMX was not changed in STAD tumor tissues.
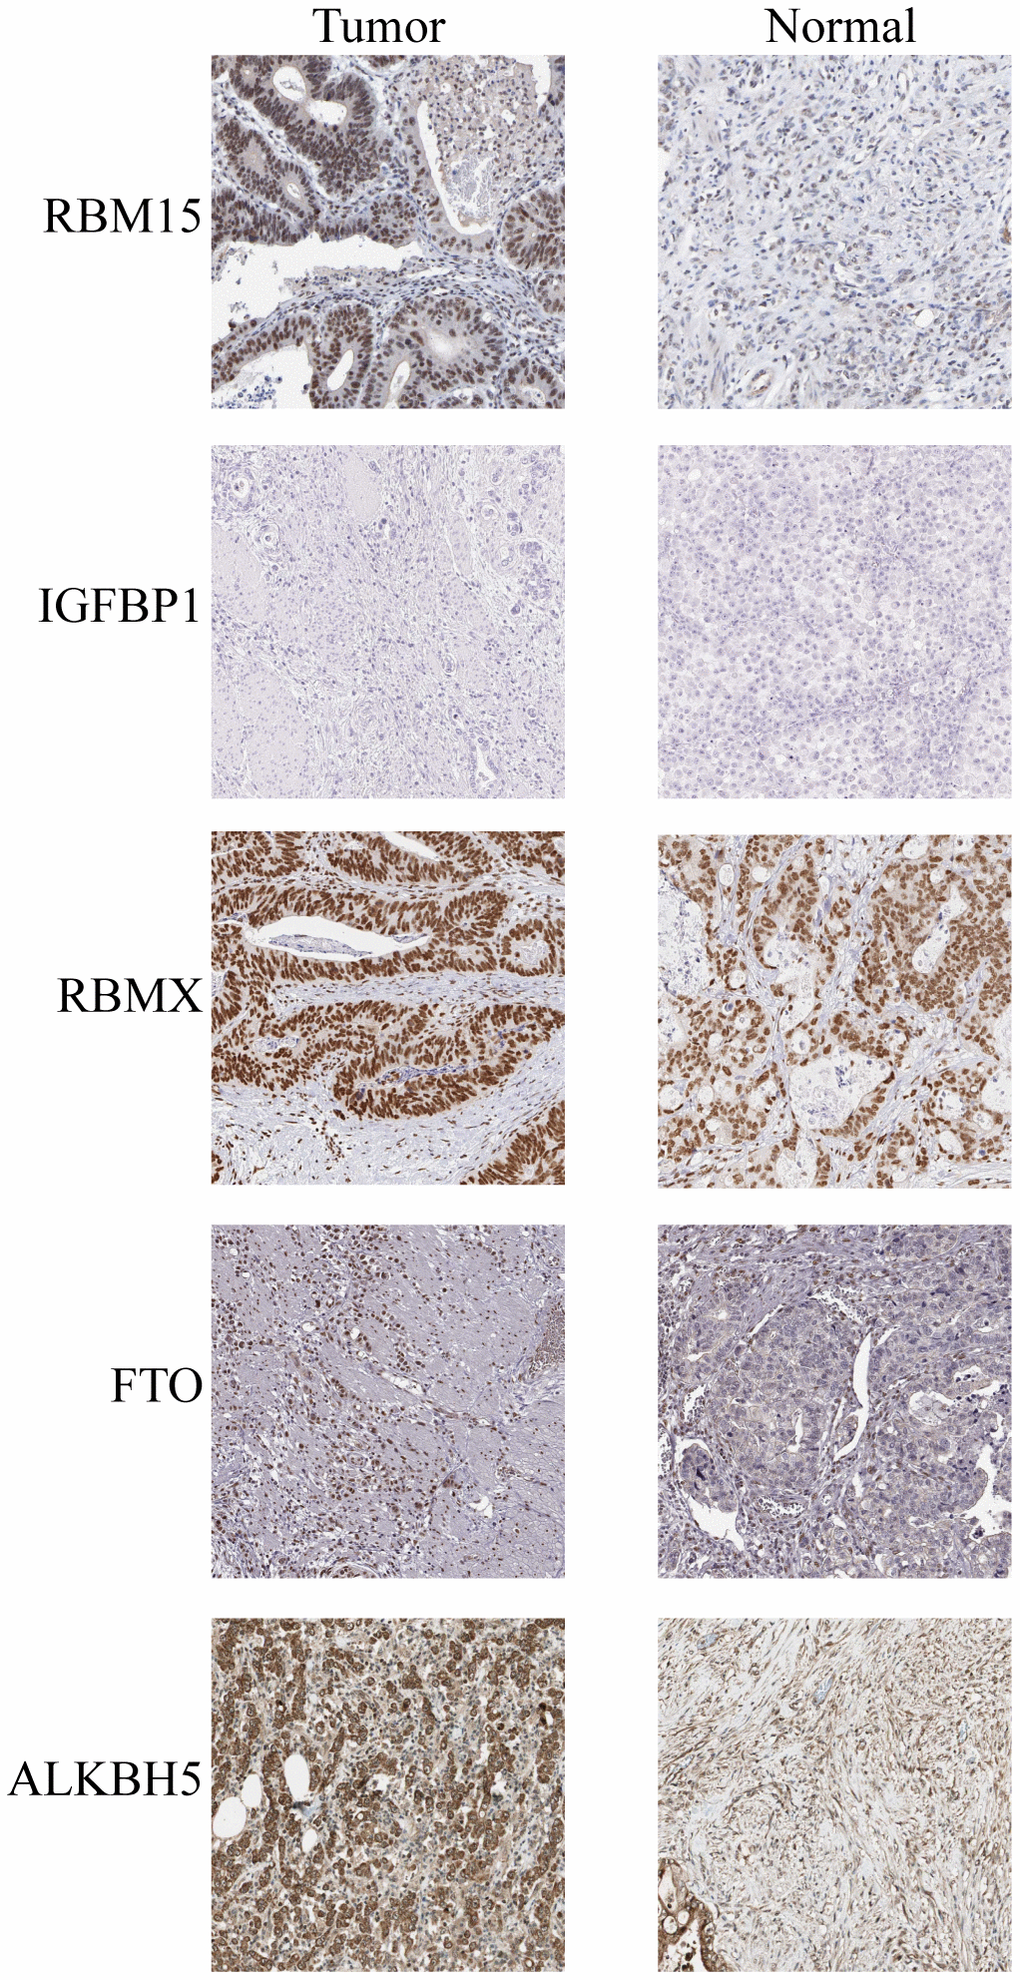
Figure 8. IHC analysis of five m6A modulators in stomach adenocarcinoma tissues and adjacent normal tissues.
Discussion
There is growing evidence that m6A methylation, the most common post-transcriptional modification, regulates inflammation, immunity, and anti-tumor interactions with various m6A regulators. Additionally, as various articles illustrate only the impact of one or two regulators on TIME, it is required to comprehensively characterize several m6A regulator-mediated immune cells to understand how m6A methylation occurs within TIME. To date, the effect of m6A modulators on the TIME of STAD has not been fully understood. Determining the role of m6A modulators within TIME can elucidate the anticancer responses regulated by m6A methylation and contribute to developing effective chemotherapeutic and immunotherapeutic treatments.
This study constructed three immunophenotypes by adopting a total of 23 m6A regulators associated with STAD prognosis and distinct temporal characteristics. m6A cluster A had higher adaptive immune cell infiltration levels, indicating an immunoinflammatory phenotype. m6A cluster B was related to increased stromal cell and innate immunocyte infiltration degrees, corresponding to an immune-excluded phenotype. Similarly, m6A cluster C had the features of temporal suppression related to the immune-desert phenotype. This study indicates that immune-desert phenotypes lack primed and activated T cells, and this is related to immune evasion reported previously [20, 29, 30]. Moreover, m6A cluster A displayed a close association with a higher lymphocyte infiltration degree. Moreover, m6A cluster A displayed a close association with a higher lymphocyte infiltration degree, demonstrating that it might be used to predict immunotherapeutic response. Consequently, the m6A cluster A group possibly gained more survival benefits from ICB therapy. Overlapping DEGs identified from the three m6A phenotypes were closely related to immune pathways and RNA modification; consequently, such DEGs were the “real” m6A-related genes. Three transcriptome isoforms have also been discovered according to those identified m6A-related genes indicating their crucial role in shaping TIME. After that, this work constructed the m6A score scoring system for differentiating m6A modification-derived heterogeneity in individual cases to precisely guide the therapeutic strategies for STAD individuals. Our results showed that the immune-desert phenotype-featured m6A modification pattern showed increased m6A scores, whereas the immune-inflammatory phenotype-featured pattern had decreased m6A scores.
Furthermore, m6A scores might be adopted as prognostic markers, which were related to TMB and mutation-associated signatures. The m6A score served as the favorable prognostic biomarker for genomic aberrations based on the above findings.
A positive correlation was demonstrated between m6A scores and ICB therapeutic predictors, suggesting the potential influence of m6A methylation on the immunotherapy response among patients. Accuracy verification was conducted on the identified immunophenotype using the IMvigor210 cohort, which demonstrated that the m6A score in concert with multiple biomarkers (e.g., TMB, neoantigen load, the composition of TIME) was more effective in predicting the outcome of immunotherapy in patients [20]. We also utilized another two independent immunotherapy cohorts to perform prognostic power validation of m6A score in the immune response against PD-1/L1, and we further found that patients with high m6A anticancer drugs work better. Based on the above findings, the m6A score can be used to comprehensively identify immune-related phenotypes and guide clinical treatment decisions for immunotherapy and anticancer drugs.
In addition, the functionality of specific m6A regulators has been clarified for the TIME adjustment. In agreement with the latest research findings, m6A enhances mRNA stability and transports specific mRNAs into the cytoplasm mainly via the hnRNP A2/B1 binding protein in cells [31]. Additionally, hnRNP A2/B1 has been shown to play an oncogenic role in certain carcinomas, as evident from its facilitation of tumor development and migration [32–34]. Our analytical work noted up-regulation of hnRNP A2/B1 in tumors, exhibiting an association with survival reduction. Furthermore, high expression of hnRNP A2/B1 showed a lower tendency to infiltrate different types of DCs, s indicating that hnRNP A2/B1 might be involved in the DC initiation. Through analyzing the TCGA-STAD cohort, we also evaluated the mutant driver genes, key underpinnings of tumor diagnosis, and treatment options. Despite the addition of 23 m6A regulators in this mode, novel regulators still need to be picked to optimize the m6A score accuracy. Given the lack of an adequate immunotherapy cohort based on STAD, we expect various STAD regimens (e.g., anti-PD-1/L1 or anti-CTLA-4) will validate our conclusions. Besides, since the regulators and scores of m6A were identified by means of retrospective datasets, a prospective cohort of patients undergoing immunotherapy was required. Moreover, not all cohorts demonstrated that ICB therapy was conducive to the patients marking low m6A scores; thus, the model accuracy must be validated and modified based on a large sample of multi-center clinical populations in conjunction with more clinical traits.
In conclusion, we developed a comprehensive multi-cohort-based assessment of the m6A regulators’ TIME properties. Based on our comprehensive assessment, we conclude that m6A modification is key for tumor immunomodulation. The development of more efficacious and profound protocols of immunotherapy will be guided by a comprehensive evaluation of the m6A modifications in TIME.
Author Contributions
GDS and YYW conceived and designed the experiments. YL, HJG, YCW and YYW analyzed data. GDS and YYW wrote this manuscript. All authors read and approved the final manuscript.
Conflicts of Interest
The authors declare that they have no conflicts of interest.
Ethical Statement and Consent
The Ethics Committee of Tangdu Hospital of Air Force Military Medical University granted its approval for this study, and all participants or their guardians signed written informed consent.
Funding
We acknowledge the financial support from Fourth Military Medical University Doctoral Science Foundation (2021D08wyy) and Affiliated Hospital of Qingdao University Youth Research Funds (No. QDFYQN202101013).
Editorial Note
This corresponding author has a verified history of publications using a personal email address for correspondence.
References
- 1. Siegel RL, Miller KD, Jemal A. Cancer statistics, 2020. CA Cancer J Clin. 2020; 70:7–30. https://doi.org/10.3322/caac.21590 [PubMed]
- 2. Rugge M, Meggio A, Pravadelli C, Barbareschi M, Fassan M, Gentilini M, Zorzi M, Pretis G, Graham DY, Genta RM. Gastritis staging in the endoscopic follow-up for the secondary prevention of gastric cancer: a 5-year prospective study of 1755 patients. Gut. 2019; 68:11–7. https://doi.org/10.1136/gutjnl-2017-314600 [PubMed]
- 3. Digklia A, Wagner AD. Advanced gastric cancer: Current treatment landscape and future perspectives. World J Gastroenterol. 2016; 22:2403–14. https://doi.org/10.3748/wjg.v22.i8.2403 [PubMed]
- 4. Begik O, Lucas MC, Liu H, Ramirez JM, Mattick JS, Novoa EM. Integrative analyses of the RNA modification machinery reveal tissue- and cancer-specific signatures. Genome Biol. 2020; 21:97. https://doi.org/10.1186/s13059-020-02009-z [PubMed]
- 5. Barbieri I, Kouzarides T. Role of RNA modifications in cancer. Nat Rev Cancer. 2020; 20:303–22. https://doi.org/10.1038/s41568-020-0253-2 [PubMed]
- 6. Xie S, Chen W, Chen K, Chang Y, Yang F, Lin A, Shu Q, Zhou T, Yan X. Emerging roles of RNA methylation in gastrointestinal cancers. Cancer Cell Int. 2020; 20:585. https://doi.org/10.1186/s12935-020-01679-w [PubMed]
- 7. He PC, He C. m6 A RNA methylation: from mechanisms to therapeutic potential. EMBO J. 2021; 40:e105977. https://doi.org/10.15252/embj.2020105977 [PubMed]
- 8. Karthiya R, Khandelia P. m6A RNA Methylation: Ramifications for Gene Expression and Human Health. Mol Biotechnol. 2020; 62:467–84. https://doi.org/10.1007/s12033-020-00269-5 [PubMed]
- 9. Han H, Yang C, Zhang S, Cheng M, Guo S, Zhu Y, Ma J, Liang Y, Wang L, Zheng S, Wang Z, Chen D, Jiang YZ, Lin S. METTL3-mediated m6A mRNA modification promotes esophageal cancer initiation and progression via Notch signaling pathway. Mol Ther Nucleic Acids. 2021; 26:333–46. https://doi.org/10.1016/j.omtn.2021.07.007 [PubMed]
- 10. Wang Q, Chen C, Ding Q, Zhao Y, Wang Z, Chen J, Jiang Z, Zhang Y, Xu G, Zhang J, Zhou J, Sun B, Zou X, Wang S. METTL3-mediated m6A modification of HDGF mRNA promotes gastric cancer progression and has prognostic significance. Gut. 2020; 69:1193–205. https://doi.org/10.1136/gutjnl-2019-319639 [PubMed]
- 11. Lou X, Wang JJ, Wei YQ, Sun JJ. Emerging role of RNA modification N6-methyladenosine in immune evasion. Cell Death Dis. 2021; 12:300. https://doi.org/10.1038/s41419-021-03585-z [PubMed]
- 12. Shulman Z, Stern-Ginossar N. The RNA modification N6-methyladenosine as a novel regulator of the immune system. Nat Immunol. 2020; 21:501–12. https://doi.org/10.1038/s41590-020-0650-4 [PubMed]
- 13. Li M, Zha X, Wang S. The role of N6-methyladenosine mRNA in the tumor microenvironment. Biochim Biophys Acta Rev Cancer. 2021; 1875:188522. https://doi.org/10.1016/j.bbcan.2021.188522 [PubMed]
- 14. Han D, Liu J, Chen C, Dong L, Liu Y, Chang R, Huang X, Liu Y, Wang J, Dougherty U, Bissonnette MB, Shen B, Weichselbaum RR, et al. Anti-tumour immunity controlled through mRNA m6A methylation and YTHDF1 in dendritic cells. Nature. 2019; 566:270–4. https://doi.org/10.1038/s41586-019-0916-x [PubMed] Erratum in: Nature. 2019; 568:E3. https://doi.org/10.1038/s41586-019-1046-1 [PubMed]
- 15. Yang S, Wei J, Cui YH, Park G, Shah P, Deng Y, Aplin AE, Lu Z, Hwang S, He C, He YY. m6A mRNA demethylase FTO regulates melanoma tumorigenicity and response to anti-PD-1 blockade. Nat Commun. 2019; 10:2782. https://doi.org/10.1038/s41467-019-10669-0 [PubMed]
- 16. Chen DS, Mellman I. Elements of cancer immunity and the cancer-immune set point. Nature. 2017; 541:321–30. https://doi.org/10.1038/nature21349 [PubMed]
- 17. Wilkerson MD, Hayes DN. ConsensusClusterPlus: a class discovery tool with confidence assessments and item tracking. Bioinformatics. 2010; 26:1572–3. https://doi.org/10.1093/bioinformatics/btq170 [PubMed]
- 18. Hänzelmann S, Castelo R, Guinney J. GSVA: gene set variation analysis for microarray and RNA-seq data. BMC Bioinformatics. 2013; 14:7. https://doi.org/10.1186/1471-2105-14-7 [PubMed]
- 19. Subramanian A, Tamayo P, Mootha VK, Mukherjee S, Ebert BL, Gillette MA, Paulovich A, Pomeroy SL, Golub TR, Lander ES, Mesirov JP. Gene set enrichment analysis: a knowledge-based approach for interpreting genome-wide expression profiles. Proc Natl Acad Sci USA. 2005; 102:15545–50. https://doi.org/10.1073/pnas.0506580102 [PubMed]
- 20. Mariathasan S, Turley SJ, Nickles D, Castiglioni A, Yuen K, Wang Y, Kadel EE III, Koeppen H, Astarita JL, Cubas R, Jhunjhunwala S, Banchereau R, Yang Y, et al. TGFβ attenuates tumour response to PD-L1 blockade by contributing to exclusion of T cells. Nature. 2018; 554:544–8. https://doi.org/10.1038/nature25501 [PubMed]
- 21. Wu T, Hu E, Xu S, Chen M, Guo P, Dai Z, Feng T, Zhou L, Tang W, Zhan L, Fu X, Liu S, Bo X, Yu G. clusterProfiler 4.0: A universal enrichment tool for interpreting omics data. Innovation (Camb). 2021; 2:100141. https://doi.org/10.1016/j.xinn.2021.100141 [PubMed]
- 22. Ritchie ME, Phipson B, Wu D, Hu Y, Law CW, Shi W, Smyth GK. limma powers differential expression analyses for RNA-sequencing and microarray studies. Nucleic Acids Res. 2015; 43:e47. https://doi.org/10.1093/nar/gkv007 [PubMed]
- 23. Zeng D, Li M, Zhou R, Zhang J, Sun H, Shi M, Bin J, Liao Y, Rao J, Liao W. Tumor Microenvironment Characterization in Gastric Cancer Identifies Prognostic and Immunotherapeutically Relevant Gene Signatures. Cancer Immunol Res. 2019; 7:737–50. https://doi.org/10.1158/2326-6066.CIR-18-0436 [PubMed]
- 24. Zhang B, Wu Q, Li B, Wang D, Wang L, Zhou YL. m6A regulator-mediated methylation modification patterns and tumor microenvironment infiltration characterization in gastric cancer. Mol Cancer. 2020; 19:53. https://doi.org/10.1186/s12943-020-01170-0 [PubMed]
- 25. Charoentong P, Finotello F, Angelova M, Mayer C, Efremova M, Rieder D, Hackl H, Trajanoski Z. Pan-cancer Immunogenomic Analyses Reveal Genotype-Immunophenotype Relationships and Predictors of Response to Checkpoint Blockade. Cell Rep. 2017; 18:248–62. https://doi.org/10.1016/j.celrep.2016.12.019 [PubMed]
- 26. Hugo W, Zaretsky JM, Sun L, Song C, Moreno BH, Hu-Lieskovan S, Berent-Maoz B, Pang J, Chmielowski B, Cherry G, Seja E, Lomeli S, Kong X, et al. Genomic and Transcriptomic Features of Response to Anti-PD-1 Therapy in Metastatic Melanoma. Cell. 2017; 168:542. https://doi.org/10.1016/j.cell.2017.01.010 [PubMed]
- 27. Yang W, Soares J, Greninger P, Edelman EJ, Lightfoot H, Forbes S, Bindal N, Beare D, Smith JA, Thompson IR, Ramaswamy S, Futreal PA, Haber DA, et al. Genomics of Drug Sensitivity in Cancer (GDSC): a resource for therapeutic biomarker discovery in cancer cells. Nucleic Acids Res. 2013; 41:D955–61. https://doi.org/10.1093/nar/gks1111 [PubMed]
- 28. Geeleher P, Cox NJ, Huang RS. Clinical drug response can be predicted using baseline gene expression levels and in vitro drug sensitivity in cell lines. Genome Biol. 2014; 15:R47. https://doi.org/10.1186/gb-2014-15-3-r47 [PubMed]
- 29. Kim JM, Chen DS. Immune escape to PD-L1/PD-1 blockade: seven steps to success (or failure). Ann Oncol. 2016; 27:1492–504. https://doi.org/10.1093/annonc/mdw217 [PubMed]
- 30. Panagi M, Voutouri C, Mpekris F, Papageorgis P, Martin MR, Martin JD, Demetriou P, Pierides C, Polydorou C, Stylianou A, Louca M, Koumas L, Costeas P, et al. TGF-β inhibition combined with cytotoxic nanomedicine normalizes triple negative breast cancer microenvironment towards anti-tumor immunity. Theranostics. 2020; 10:1910–22. https://doi.org/10.7150/thno.36936 [PubMed]
- 31. Liu Y, Shi SL. The roles of hnRNP A2/B1 in RNA biology and disease. Wiley Interdiscip Rev RNA. 2021; 12:e1612. https://doi.org/10.1002/wrna.1612 [PubMed]
- 32. Wang H, Liang L, Dong Q, Huan L, He J, Li B, Yang C, Jin H, Wei L, Yu C, Zhao F, Li J, Yao M, et al. Long noncoding RNA miR503HG, a prognostic indicator, inhibits tumor metastasis by regulating the HNRNPA2B1/NF-κB pathway in hepatocellular carcinoma. Theranostics. 2018; 8:2814–29. https://doi.org/10.7150/thno.23012 [PubMed]
- 33. Zhang Y, Huang W, Yuan Y, Li J, Wu J, Yu J, He Y, Wei Z, Zhang C. Long non-coding RNA H19 promotes colorectal cancer metastasis via binding to hnRNPA2B1. J Exp Clin Cancer Res. 2020; 39:141. https://doi.org/10.1186/s13046-020-01619-6 [PubMed]
- 34. Meng LD, Shi GD, Ge WL, Huang XM, Chen Q, Yuan H, Wu PF, Lu YC, Shen P, Zhang YH, Cao SJ, Miao Y, Tu M, Jiang KR. Linc01232 promotes the metastasis of pancreatic cancer by suppressing the ubiquitin-mediated degradation of HNRNPA2B1 and activating the A-Raf-induced MAPK/ERK signaling pathway. Cancer Lett. 2020; 494:107–20. https://doi.org/10.1016/j.canlet.2020.08.001 [PubMed]