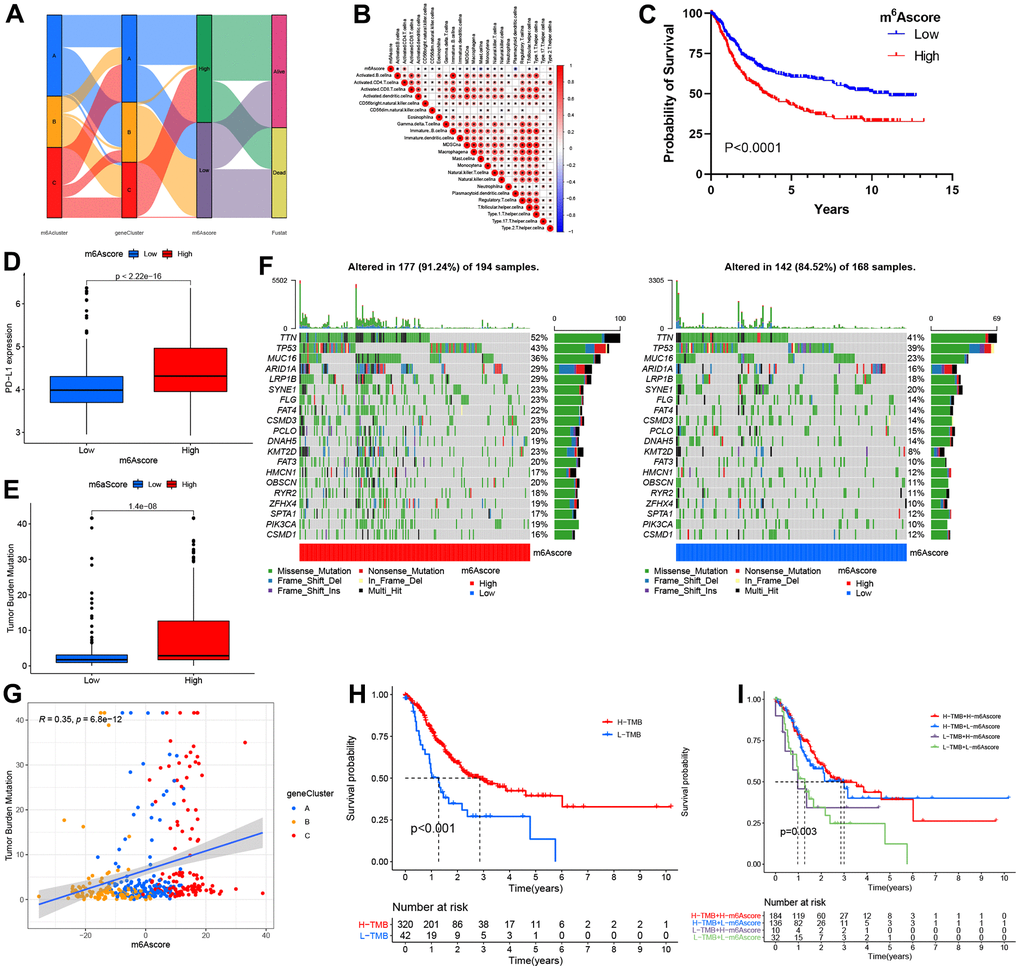
Figure 6.The m6A score construction and relevant genetic trait assessment. (A) Alluvial chart of m6A clusters regarding gene cluster and score of m6A, as well as patient survival. (B) Spearman correlations of m6A score with immunocytes. (C) Survival findings for the TCGA cohort patients marking high and low m6A scores. (D) PD-L1 level comparison between patients marking high and low m6A scores. (E) TMB (tumor mutation burden) distribution comparison between patients marking high and low m6A scores. (F) Mutational waterfall plot for the TCGA cohort patients marking high (left panel) and low (right panel) m6A scores. All patients were represented by individual columns. (G) Diagram illustrating significant positive association of m6A score with TMB (R = 0.35, p = 6.8–12). (H) Kaplan–Meier plots for patients exhibiting high (H) and low (L) TMBs. (P< 0.001). (I) Kaplan–Meier plots for the TCGA cohort patients stratified by both m6A score and TMB. H, high; L, Low; TMB, tumor mutation load (P = 0.003).