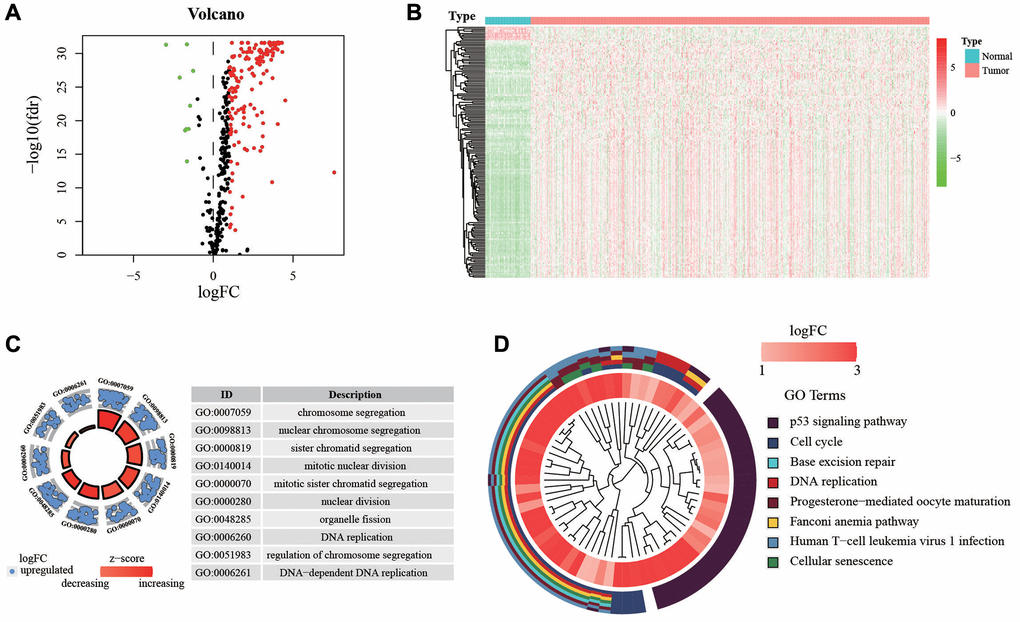
Figure 2.Expression of genes and function enrichment. (A) Volcano plot and (B) heatmap showing the DEGs between LUAD and normal lung samples. Red dots represent up-regulated and green dots represent down-regulated DEGs, black dots represent no difference, respectively (log FC >1, P < 0.05). (C) GO analysis showing the differentially expressed hypoxia-related genes. (D) The significantly enriched pathways of the DEGs determined by KEGG analysis. Abbreviations: GO: gene ontology; KEGG: Kyoto Encyclopedia of Genes and Genomes.