


Introduction
Lung adenocarcinoma (LUAD) is the most aggressive histological type of lung cancer with a consistently increasing incidence [1, 2]. The lack of early detection and effective treatment led to the persistently high mortality rate of LUAD, which makes it urgent to explore the mechanisms of LUAD. However, the traditional experimental approach limits the large-scale investigation of hub genes and pathways at the systems biology level because it can only identify one or a few genes at a time. Machine learning is a new approach to learn data-driven concepts which can help researchers uncover hidden insights [3], and it is also developed for precise classification and accurate prediction in medicine by designing models according to RNA-sequencing patterns. The molecular characteristics and therapy effects vary widely between different subtypes of lung cancer [4]. Several high-frequency genetic alternations have been identified in LUAD, such as LAMA2, DGCR5, and TTC21A [5–7].
The interaction between cancer cells and the tumor (specifically the hypoxia) microenvironment has been widely shown to affect the LAUD progression and therapy. Hypoxia can decrease the activity of immune cells and suppress the production of immune stimulants, thereby increasing the release of inhibitory factors and improving the expression of immune checkpoint inhibitors [8, 9]. Hypoxia, as a promising therapeutic target especially for radiotherapy, has been applied to most of LUAD patients. However, LUAD hypoxia-targeted therapy is still in clinical trials [10].
In this study, hypoxia-related genes (HRGs) with different expressions were screened by using large-scale sequencing and bioinformatics analysis. Hypoxia-related prognostic model was constructed via LASSO-Cox regression analysis. A prognostic nomogram, which combined prognostic gene characteristics and clinical prognostic factors, was created to predict the overall survival (OS). And the EXO1 expression levels in tumor and adjacent normal tissues were examined and the prognostic value of EXO1 in LUAD patients was evaluated.
Materials and Methods
Data acquisition and procession
The expression profiles of mRNAs (level 3) in 504 cases (504 tumor tissues and 59 adjacent normal tissues) were downloaded from TCGA database (https://portal.gdc.cancer.gov). And its corresponding clinical information of LUAD patients was also downloaded from TCGA and was shown in Supplementary Table 1. Hypoxia-related genes (HRGs) were derived from the gene set in the Molecular Signatures Database (MSigDB v6.2, http://software.broadinstitute.org/gsea/msigdb) [11]. Transcriptome profiling data of LUAD patients in the GSE19188 (91 tumor- and 65 adjacent normal samples) and GSE10072 (58 tumor and 49 non-tumor tissues) datasets from the GEO database were used for validation.
Gene set enrichment analysis (GSEA)
GSEA was conducted in the molecular signatures database (MSigDB), which provided hallmark gene sets to predict biological processes between low- and high-risk groups [15]. Annotated gene sets of hallmarker.all.v6.1.symbols.gmt in MSigDB were chosen as the references in GSEA software [16]. P < 0.05 and FDR < 0.25 was considered as obviously enriched.
Estimation of clinical independence and construction of the nomogram
Univariate and multivariate Cox regression analyses were used to determine whether the prognostic model was an independent risk factor. We then used the independent risk factors to establish the nomogram and calibration curves by the “rms” package in R language. The accuracy was examined by checking the consistency index between actual and predicted probability. Next, we showed the predicted and observed results in the calibration curve to visualize the performance of the nomogram, and the 45° line represented the best prediction. The prognostic evaluation of nomogram was then performed with Kaplan–Meier survival analysis and the area under the tdROC curve (AUC). Finally, we measured Harrel's concordance index (C-index) to validate the predictive capability of the nomogram [17].
In vitro validation of hub genes
Proteins were extracted and western blot was performed as previous described [18]. Total RNA was extracted using TRIzol reagent (Tiangen, China). cDNAs were reverse transcribed into mRNA through PrimeScript RT-polymerase (Vazyme). qRT-PCR was carried out by using SYBR-Green Premix (Vazyme) with specific PCR primers (ThermoFisher, USA), with Glyceraldehyde-3-phosphate dehydrogenase as an internal reference. The gene expression level was analyzed using the 2−ΔΔCt method. All steps of qRT-PCR follow the instructions.
Results
Differentially expressed HRGs in patients with LUAD
The design of the study was shown in Figure 1. First, we extracted the expression of HRGs from the TCGA database. These HRGs were performed with differentially expressed analysis, and 166 differentially expressed HRGs were obtained, including 9 down-regulated and 157 up-regulated genes (Figure 2A, 2B). During enrichment analyses for these DE-HRGs, these genes were mainly found to play a role in “chromosome segregation”, “nuclear chromosome segregation”, “sister chromatid segregation”, and “mitotic nuclear division” for GO enrichment, and “Cell cycle”, “DNA replication”, and “p53 signaling pathway” as shown in Kyoto Encyclopedia of Genes and Genomes (KEGG, Figure 2C, 2D). The above findings suggested that these DE-HRGs were strongly associated with the development, progression and proliferation of LUAD cells.
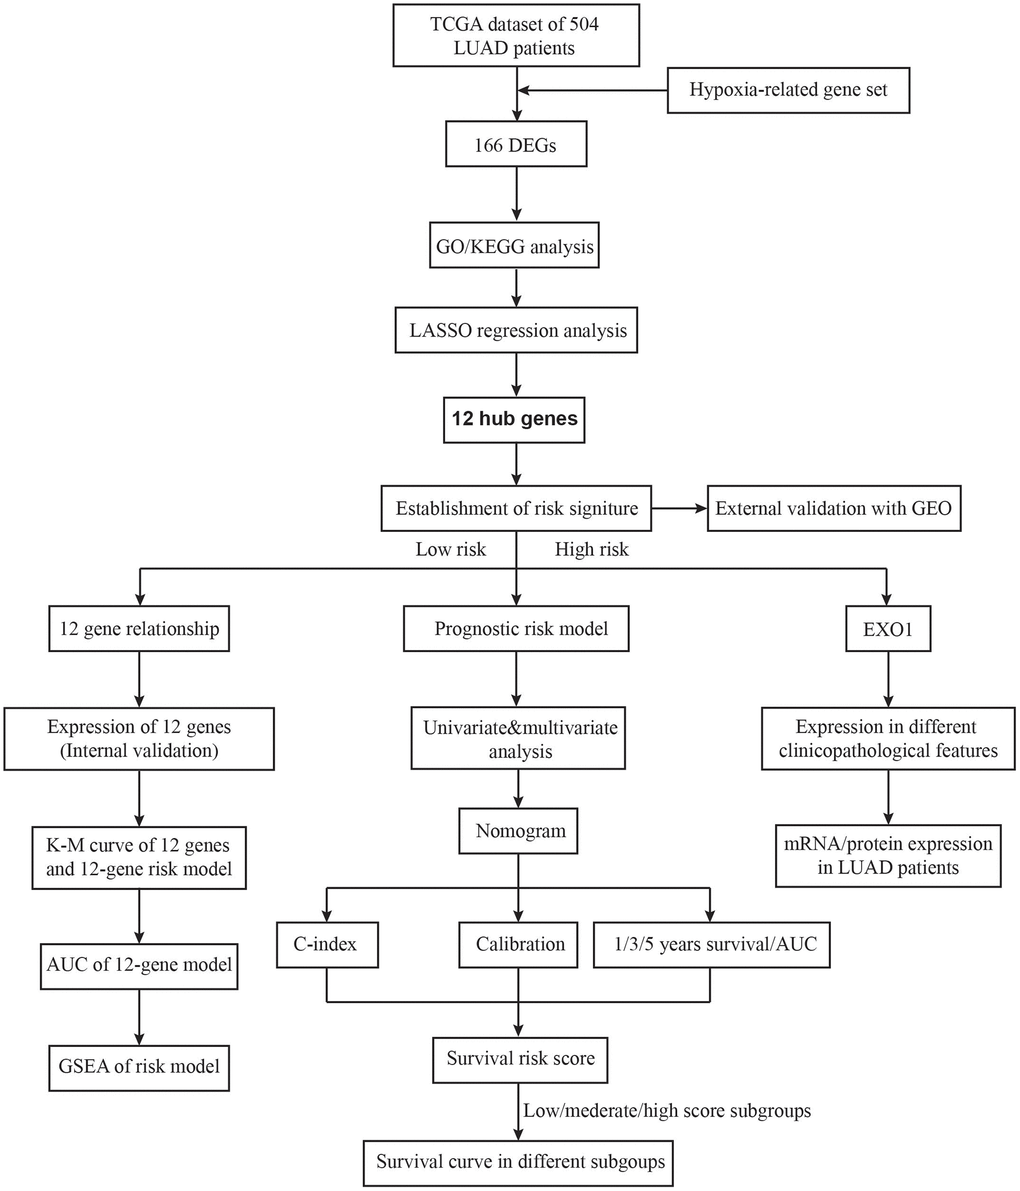
Figure 1. The flow chart of the study design.
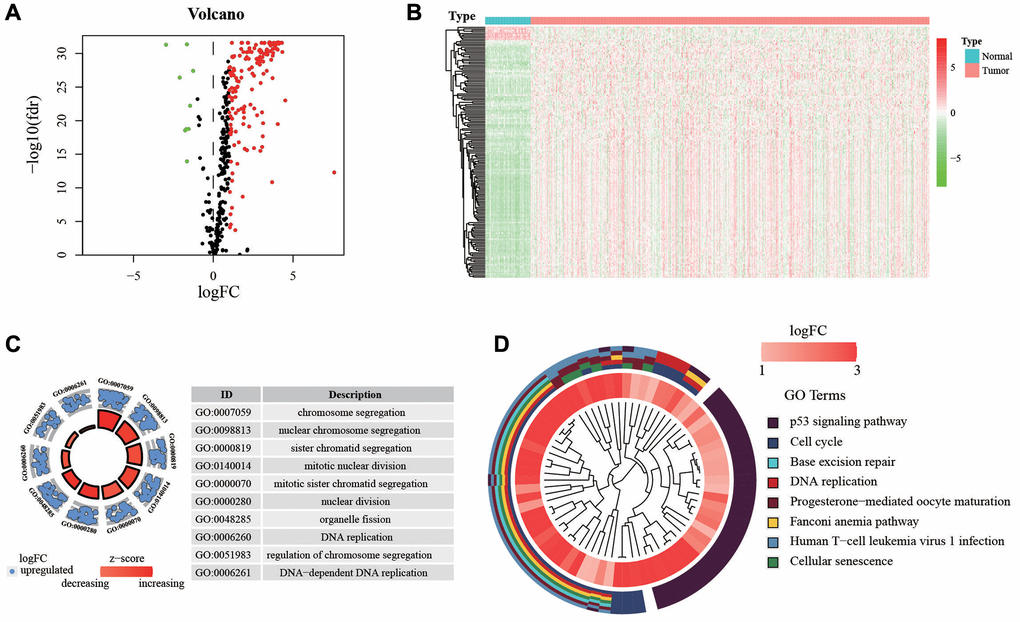
Figure 2. Expression of genes and function enrichment. (A) Volcano plot and (B) heatmap showing the DEGs between LUAD and normal lung samples. Red dots represent up-regulated and green dots represent down-regulated DEGs, black dots represent no difference, respectively (log FC >1, P < 0.05). (C) GO analysis showing the differentially expressed hypoxia-related genes. (D) The significantly enriched pathways of the DEGs determined by KEGG analysis. Abbreviations: GO: gene ontology; KEGG: Kyoto Encyclopedia of Genes and Genomes.
Establishment of a 12 HRGs-based prognostic signature
For screening out the DE-HRGs with potentially prognostic value for LUAD patients, LASSO regression was used. LASSO analyses identified 12 genes significantly associated with prognosis: IGFBP3, DDIT4, PHLDA2, RRAS, WDR4, EXO1, ECT2, TYMS, CDC25C, PLK1, FERMT1, and PCSK9. (Figure 3A, 3B). According to the results of LASSO regression analysis, we used the coefficients (Table 1) to construct the prognostic model as following: risk score = (CDC25C × 0.37358) + (DDIT4 × 0.34287) + (ECT2 × 0.12761) + (EXO1 × 0.29731) + (FERMT1 × 0.89012) + (IGFBP3 × 0.29168) + (PCSK9 × 0.52722) + (PHLDA2 × 0.40304) + (PLK1 × 0.91384) + (RRAS × 0.43750) + (TYMS × 0.49112) + (WDR4 × 0.26711). Patients were ranked in ascending order by score and divided into high- and low-risk subgroups using median risk values as a reference. Besides, the expression of the 12 genes in low- and high-risk patients in the TCGA dataset was also demonstrated in the heatmap. The expression profiles of the 12 prognostic DE-HRGs showed that all of the 12 genes were expressed at higher levels in the high-risk subgroup. We also found significant differences between the high- and low-risk groups associated with tumor status, stage, stage_T, stage_N, stage_M, gender, and living status (Figure 3C). We further analyzed the relationship between the 12 genes. We found that they were significantly relevant, especially between EXO1 and PLK1, ECT2 and PLK1, IGFBP3 and CDC25C, TYMS and CDC25C (Figure 3D). Furthermore, we analyzed the gene expression of the 12 genes in different tissues types. We found that expression levels of PCSK9 and RRAS were significantly higher in normal tissue, and the rest 10 genes were overexpressed in tumor tissues (Figure 3E).
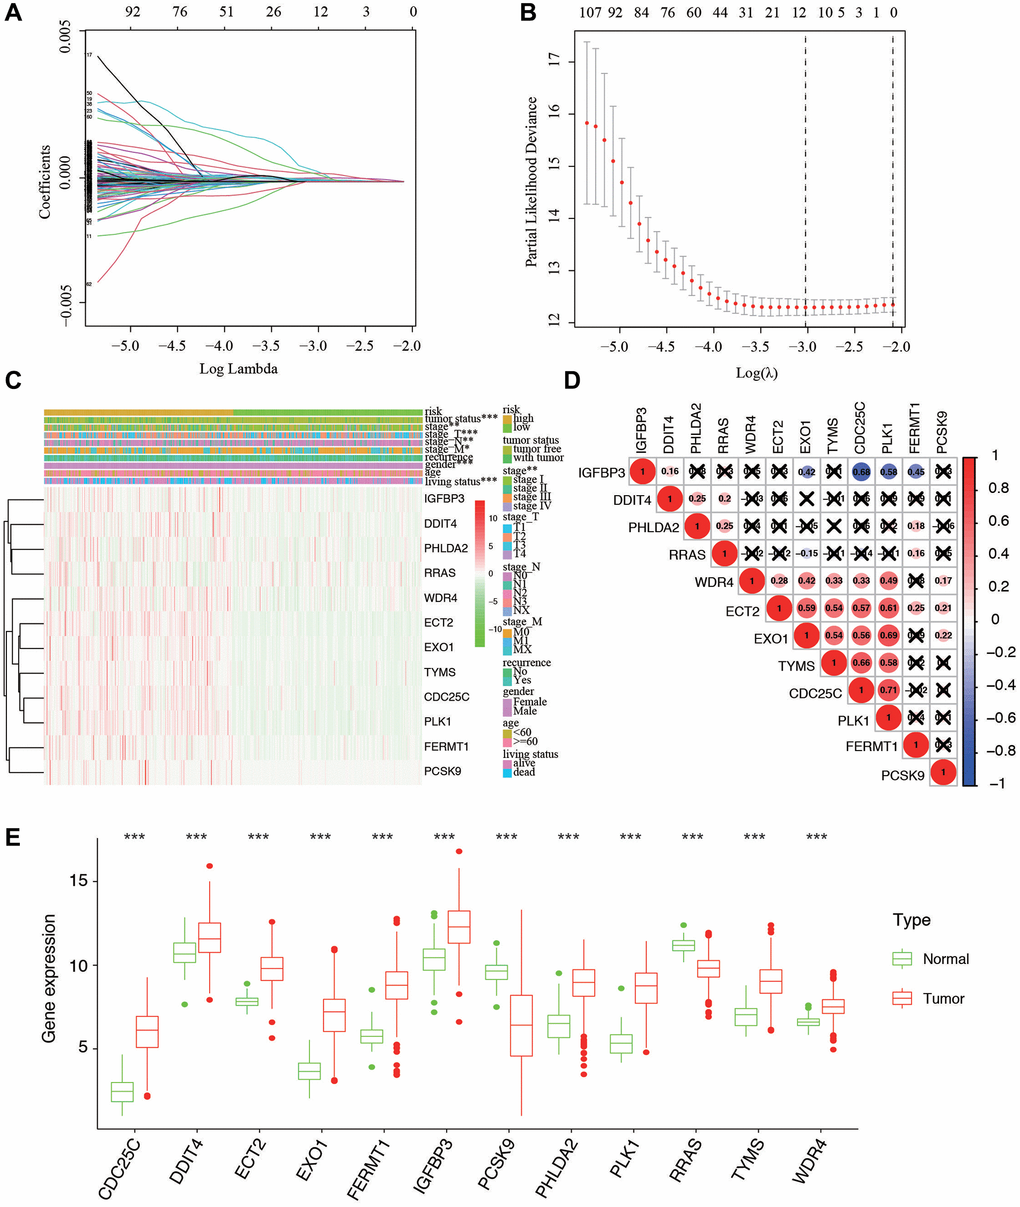
Figure 3. Ten-fold cross-validation for tuning parameter selection and a gene expression. (A) Plots of the ten-fold cross-validation error rates. (B) LASSO coefficient profiles of the twelve hypoxia-related genes. (C) Relationship between the risk score and clinical significance. (***P-value < 0.001, **P-value < 0.01, and *P-value < 0.05). (D) Associations between the 12 genes. (E) The expression of the 12 genes in different types of tissues.
Table 1. Twelve hypoxia-associated genes and corresponding coefficient value.
| Hypoxia associated gene | Coefficient |
| IGFBP3 | 0. 29168 |
| DDIT4 | 0. 34287 |
| PHLDA2 | 0. 40304 |
| RRAS | 0. 43750 |
| WDR4 | 0. 26711 |
| EXO1 | 0. 29731 |
| ECT2 | 0. 12761 |
| TYMS | 0. 49112 |
| CDC25C | 0.37358 |
| PLK1 | 0. 91384 |
| FERMT1 | 0. 89012 |
| PCSK9 | 0. 52722 |
| Risk score | Low: < 1.66 |
| High: ≥ 1.66 |
Efficiency of predicting the patients' outcomes with the 12 HRGs signature
The individual risk score and survival status was shown on the dot plot, with significantly different OS between two groups (Figure 4A, 4B). As indicated by Kaplan-Meier curve, the higher-risk group has significantly shorter OS than the low-risk group (P = 2.437e−07) (Figure 4C). The area under the ROC curve (AUC) of the prognostic HRGs model for 1-, 3-, 5-year OS was 0.695, 0.718, and 0.702, respectively (Figure 4D). GSEA analysis showed that the high-risk samples were mainly enriched in pathways of apoptosis, cholesterol homeostasis, and EMT; while the low-risk samples were mainly in PI3K-AKT-mTOR, Notch, and mTORC1 signaling pathways (Figure 4E).
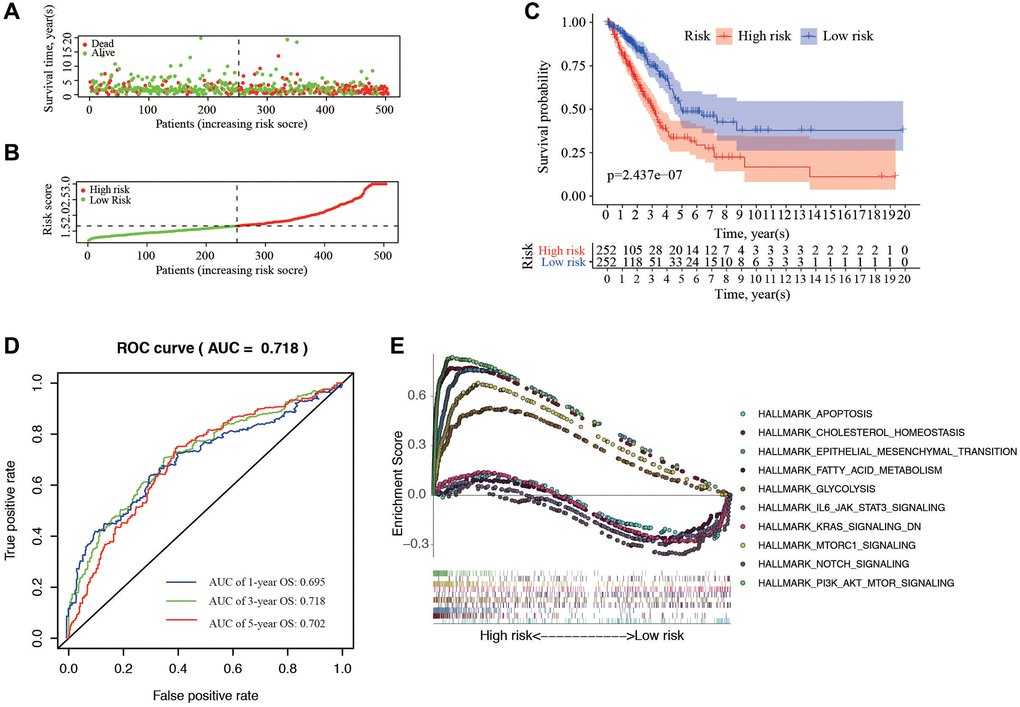
Figure 4. Correlation between the risk score and overall survival. (A, B) Distribution of risk score and patient survival status of LUAD. (C) The Kaplan–Meier curve demonstrates that patients in the high-risk group have a poorer prognosis. (D) Time-dependent ROC curve of 1-, 3-, and 5-year analysis for survival prediction by the risk score. (E) Hallmark analysis of Gene Set Enrichment Analysis (GSEA) in high-risk and low-risk groups.
Construction and validation of nomogram for OS prediction
To supply a better quantitative approach to predict the prognosis of cancer patients, a prognostic nomogram was built by integrating the all independent OS risk score and other clinicopathological risk factors. Cox regression analysis (Univariate and multivariate) was performed using clinicopathological and HRGs features for the OS of LUAD prediction. Recurrence, stage, tumor status, and risk signature were all taken as the independent risk factors of OS (Figure 5A), and they were used to establish OS nomogram (Figure 5B). The predicted value was consistent with the actual 1-, 3-, and 5-year OS time, as displayed the nomogram (Figure 5C). The score details of different factors were shown in Table 2. The C-index of the model was 0.75 (95% CI: 0.68–0.82). Based on the risk scores from the nomogram, the cohort was evenly divided into 3 subgroups (low-, moderate-e, and high-score groups), in which the high-score group had a worse OS than the moderate- and low-score groups (Figure 5D). The AUC of 1-, 3-, 5-year OS was 0.774, 0.796, and 0.811, respectively, which represent the predictive abilities of the nomogram (Figure 5E), suggesting that the nomogram had a high accuracy in predicting OS.
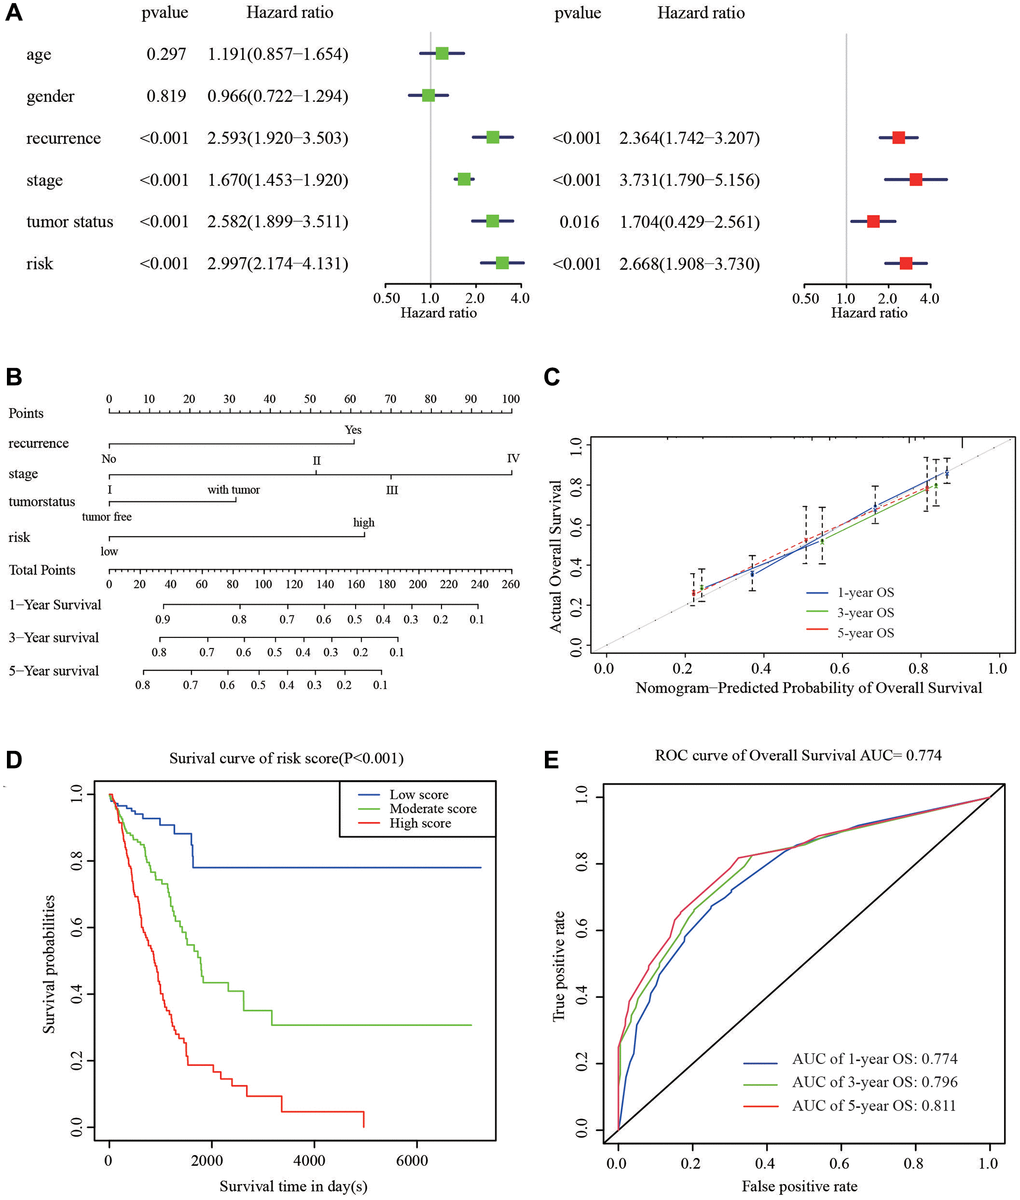
Figure 5. Nomogram to predict the probability of patients with LUAD. (A) Univariate and multivariate regression analyses of the prognostic value of clinicopathological features. (B) The nomogram to predict 1-, 3-, or 5-year OS in the LUAD patients. (C) The calibration plots for predicting patient 1-, 3-, or 5-year OS. (D) The Kaplan–Meier curves represent the survival probability of low, moderate, and high score group patients based on the nomogram. (E) The ROC curves of the nomogram of 1-, 3-, and 5-year survival.
Table 2. Corresponding risk score for each variable and total score.
| Variables | Category | Score |
| Recurrence | Recurrence | 0 |
| Recurrence free | 60 | |
| Stage | I | 0 |
| II | 50 | |
| III | 70 | |
| IV | 100 | |
| Tumor status | Tumor free | 0 |
| With tumor | 35 | |
| Risk signature | Low | 0 |
| High | 75 | |
| Total score | Low risk | 0–50 |
| Moderate risk | 60–125 | |
| High risk | ≥130 |
Verification of 12 genes for prognostic prediction
The correlations between each gene from the prognostic model and the patients’ clinical OS were also measured. Patients were divided into two cohorts according to median value of each gene. The results indicated that eleven of the twelve genes, except RRAS, were shown to be significantly associated with patient prognosis (Figure 6A–6L).
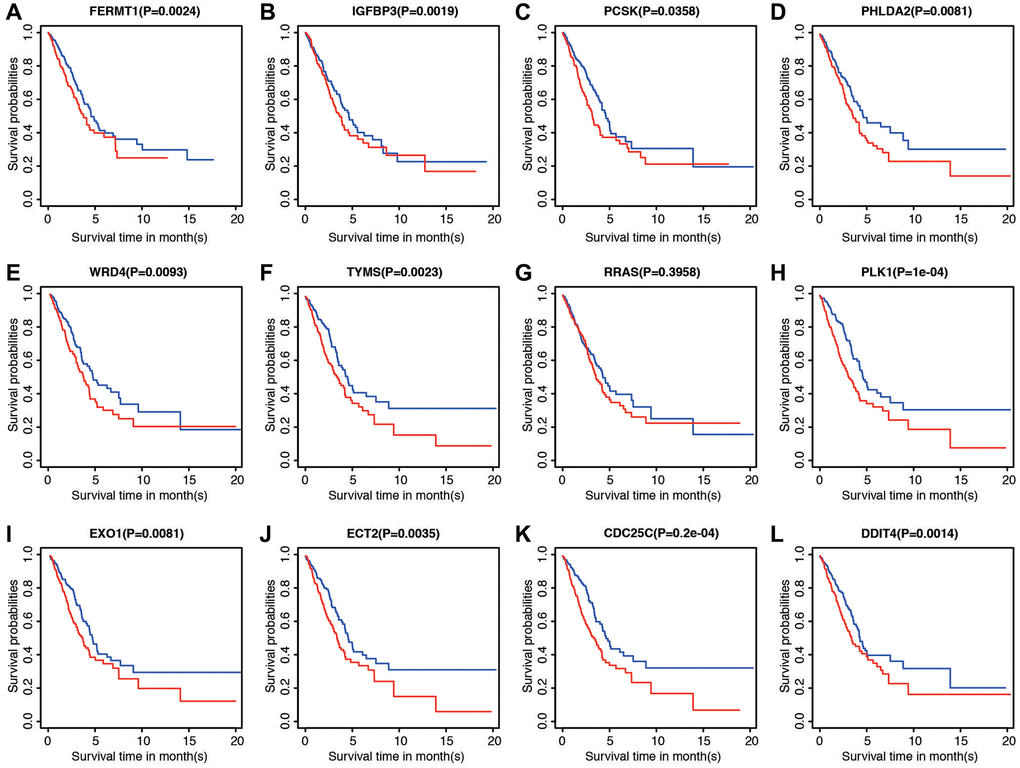
Figure 6. Prognostic significance of low and high expression of each of the 12 genes. (A) FERMT1. (B) IGFBP3. (C) PCSK. (D) PHLDA2. (E) WRD4. (F) TYMS. (G) RRAS. (H) PLK1. (I) EXO1. (J) ECT2. (K) CDC25C. (L) DDIT4.
Expression of the 12 genes in database and in vitro
We validated the expression of 12 genes in two GEO datasets, including GSE19188 and GSE 10072, by comparing the content between normal tissues and tumor tissues. The results were corresponding with that in TCGA datasets. Only PCSK9 and RRAS were overexpressed in normal tissues, and the rest of ten genes were higher in tumor tissues (Figure 7A, 7B). We then examined the correlation between the EXO1 and clinicopathological characteristics of the LUAD patients in TCGA. The analysis showed that EXO1 was statistically different in worse outcomes such as recurrence (Figure 7C), living with tumor (Figure 7D), and higher stage (Figure 7E). We performed the qPCR and western blot (WB) validation in clinical specimens following the steps described above. We verified the expression of EXO1 in the LUAD tissues and their adjacent normal tissues. By analysis, the qPCR results showed EXO1 was significantly up-regulated in the LUAD tissues, while down-regulated in normal LUAD tissues (Figure 7F). Results of WB indicated similar phenomenon (Figure 7G). These results suggested that EXO1 may play a pivotal role in the progression of LUAD.
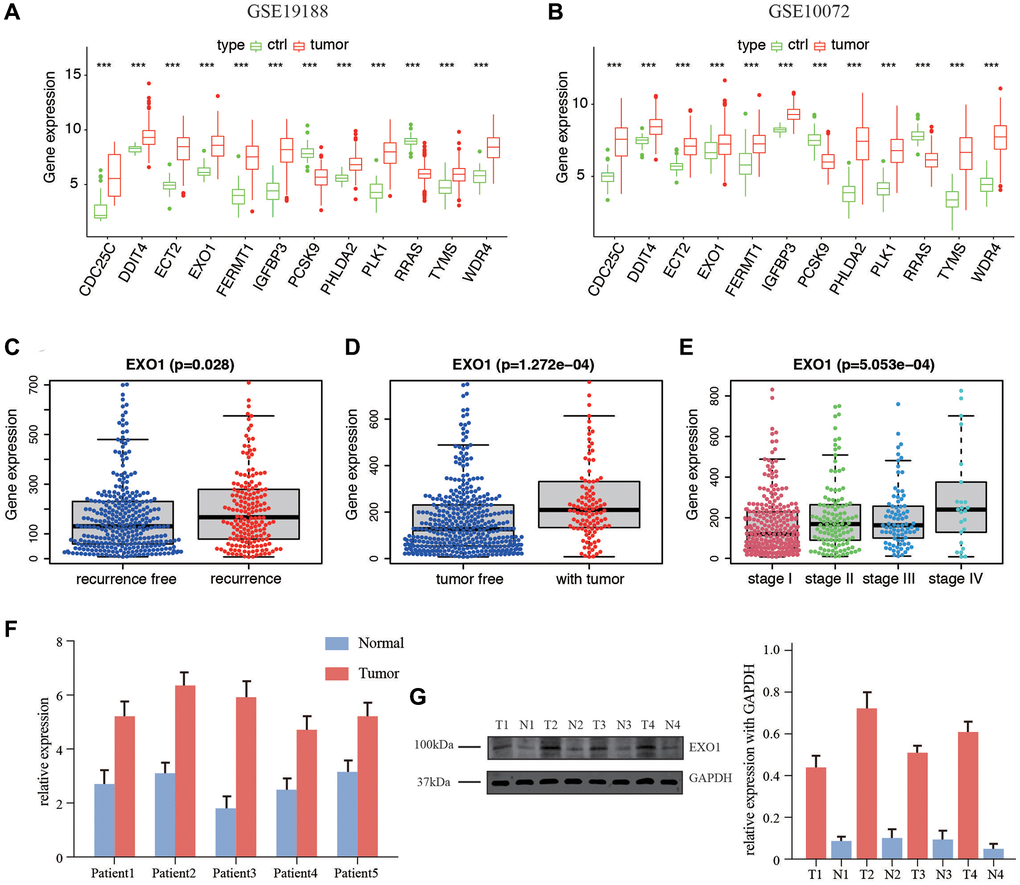
Figure 7. Expression of the 12 genes in database and in vitro validation of EXO1. (A) Gene expression in GSE19188 and (B) GSE10072. Expression of EXO1 in different (C) recurrence subgroups, (D) tumor status, and (E) stages. (F) Relative expression of EXO1 in tumor and normal tissues of 5 patients in our center for RNA level. (G) Protein level of EXO1 in patients in our center, and barplot shows its relative expression. N represents normal tissue, and T for tumor tissues.
Discussion
LUAD has become a major global health concern and the leading cause of cancer-associated mortality [19]. Although there has been more information about LUAD prognostic and predictive signatures, developing individualized treatments and prediction outcome is still challenging. Hypoxia is a common feature of most solid tumors, and it has widespread effects on metabolism, angiogenesis, and metastasis [20]. hypoxia induces a HIF1A-dependent complex molecular response [21]. Crosstalk between hypoxia and cancer-related hallmarks/pathways causes hypoxia-derived aggressive phenotypes and therapeutic resistance, which can be used as biomarkers to predict the clinical outcomes of LUAD patients at stage I [22]. Since hypoxia is a crucial factor in cancer progression, it is necessary looking for hypoxia-related biomarkers to predict the prognosis and promote the immune therapy of LUAD patients [23]. As more information about genomic changes of LUAD becomes available, some prognostic and predictive signatures were discovered and this is helpful for personalized therapy. In this study, a novel 12-gene prognostic signature was validated, which can be used to identify high-risk LUAD patients with poor prognosis. What’s more, the content of these 12 genes was also validated with two GEO datasets. Further study indicated that EXO1 is significantly up-regulated in worse clinicopathological features including recurrence, living with tumor, and higher stage. We also validated the expression of EXO1 with our own samples in RNA and protein levels.
Previous studies have identified many molecular signatures that classify patients into different prognostic groups. Cheng identified a prognostic gene signature associated with microenvironment in LAUD, and the 3-year area under the ROC curves (AUC) of the risk model reached to 0.738 [24]. Another study established an immune-related signature that could predict prognosis and reflect the tumor immune microenvironment of LUAD patients. The risk model promoted individualized treatment and provided potential novel targets for immunotherapy of LUAD patients [25]. Similarly, we also built the predictor based on 12 HRGs and the model performed well with much more higher AUC of ROC than other studies [26, 27].
Hypoxia is often caused by a supply-demand imbalance of nutrient in the tumor microenvironment. Although the incidence and severity of hypoxia in a given patient population is variable, it is a feature of the physiology of most tumors and is particularly involved in mechanisms related to certain malignant features (e.g., metastasis and invasion) [28–30]. Hypoxia-related genes are usually involved in the corresponding pathways or regulating apoptosis of these processes [31]. Taken together, tumor hypoxia might be taken as the best target. Extensive reports have demonstrated that the hypoxic microenvironment is a main factor regulating the progression and metastasis of solid tumors (including lung cancer) [32, 33]. Under hypoxic conditions, cancer cells secrete angiogenic factors to promote the abnormal angiogenesis. In addition, hypoxia causes cancer cells to be insensitive to chemotherapy or radiotherapy by increasing the malignancy of the tumor and the ability of invasion and metastasis of cancer cells [34]. Thus, the hypoxic microenvironment is an important factor for patients with LUAD. Hypoxia-inducible factor 1 (HIF-1) is a major regulator of the hypoxic response, its function has been well characterized [35]. YTHDF1, an m6A-modified mRNA-binding protein, is a high-altitude adaptation gene that was positively selected during evolution and participates in both hypoxic adaptation and the pathogenesis of LUAD [36].
In the correlative analysis, EXO1 is found to be associated with TYMS, CDC25C, and PLK1, which is the most correlative genes. What’s more, the logFC of EXO1 is 3.9, ranking the highest in cancer progression genes. Therefore we take EXO1 as our target. The function of EXO1 is mainly involved in mismatch repair and recombination. In our study, we identified EXO1 played a key role in the progression of LUAD patients. EXO1 was involved in tumor mutational burden (TMB) and its clinical significance in prostate cancer [37]. Elevated expression of EXO1 is associated with carcinogenesis and poor prognosis in breast cancer, and might act as a biomarker for breast cancer treatment [38]. EXO1 inhibited the activity of cancer progression through PARP pathway. It acted as a novel therapeutic target that serves important roles in DNA damage response. A recent study investigating the prognostic value of TP53-associated immune genes in hepatocellular cancer identified and validated a two-gene (TREM1 and EXO1) prognostic model [39].
Exonuclease 1 (EXO1) interacted with mutator S homolog 2 (MSH2) to regulate the mismatch repair and recombination [40]. The EXO1expression was up-regulated in tumor tissue [41]. It was reported that EXO1 works as a guardian of our genome to reduce cancer progression by inducing DNA damage checkpoints and DNA damage repair [42]. EXO1 is also reported as a potential prognostic biomarker for LUAD, and it is related to the infiltrating levels of immune cells. In this study, EXO1 has higher expression level in LUAD than that in the para-cancerous tissues from public databases (p < 0.01). Survival analysis demonstrated the correlation between high EXO1 expression with poor LUAD prognosis (p < 0.01). Additionally, in vitro results showed that downregulation of EXO1 inhibited the migratory ability of lung cancer cells.
To further understand the molecular function and pathway of these HRGs and risk model, we conducted functional enrichment analysis of GO, KEGG pathways, and GSEA. By performing KEGG enrichment analysis, these hypoxia-related genes were enriched in several pathways in cancers, including “p53 signaling pathway”, “cell cycle”, and “DNA replication”. Similarly, according to GO analysis, the DEGs also mainly clustered in “DNA replication” and other cell cycle-related function. In recent years, knowledge of the hypoxia features of LUAD has increased, and the development of effective immunotherapeutic strategies for LUAD has attracted much attention. The role of hypoxia functions by regulating the tumor microenvironment in LUAD therapy, especially through expression and activity of cell cycle related proteins [43, 44].
GSEA revealed that the risk model was differentially enriched in apoptosis, epithelial mesenchymal transition, fatty acid metabolism, glycolysis, Notch signaling pathway, and PI3K-AKT-mTOR signaling pathway. The activation of the Notch and PI3K-AKT-mTOR signaling pathway is a critical event which frequently occur during LUAD development, and these signaling pathways are uncovered clinically relevant to hypoxia, making it a therapeutic target for the therapy of LUAD [45, 46]. The fatty acid metabolism is important for cell growth and apoptotic regulation, making it also a potential molecular target for cancer treatment and prevention [47, 48]. Our findings suggested that these 12-gene signature may be involved in the oncogenesis and progression of LUAD.
Our study has some limitations. First, analysis on the transcriptional level can reflect some aspects of patients’ status, but not global changes. Moreover, another independent cohort and in vitro or in vivo functional studies should be performed to validate our results. Finally, mechanism validation and external validation of the patients are in need for the risk model in our study.
Conclusion
In general, we present and validate a robust prognostic model aggregating 12 signature genes based on hypoxia pathway that can be used to efficiently predict LUAD patient prognosis. However, the clinical role as well as the biological function of these 12 mRNAs needs to be further verified with more experiments, especially for EXO1, which had potential to become a therapeutic target for LUAD patients.
Supplementary Materials
Abbreviations
TCGA: The Cancer Genome Atlas; LUAD: lung adenocarcinoma; LASSO: Least Absolute Shrinkage and Selection Operator; GO: gene ontology; GSEA: gene set enrichment analysis; OS: overall survival; HRGs: hypoxia-related genes; MSigDB: Molecular Signatures Database; KEGG: Encyclopedia of Genes and Genomes; ROC: Receiver operating characteristic; AUC: area under the ROC curve; C-index: concordance index.
Author Contributions
Conceptualization: Qirui Chen; Data curation: Shuo Chen; Formal analysis: Jing Wang; Investigation: Yan Zhao; Methodology: Xin Ye; Resources: Yili Fu; Validation: Qirui Chen; Writing-original draft: Shuo Chen; Writing-review and editing: Shuo Chen and Yi Liu. The authors are accountable for all aspects of the work in ensuring that questions related to the accuracy or integrity of any part of the work are appropriately investigated and resolved.
Acknowledgments
The authors thank TCGA and GEO for sharing the melanoma data.
Conflicts of Interest
All authors have read and approved submission of the manuscript. There authors declare no conflict of interest in relation to the submission.
Funding
This work was supported by the funding by Reform and Development Program of Beijing Institute of Respiratory Medicine (YSRH2022015) and Capital’s Funds for Health Improvement and Research (2022-4-1064).
Editorial Note
This corresponding author has a verified history of publications using a personal email address for correspondence.
References
- 1. Bray F, Ferlay J, Soerjomataram I, Siegel RL, Torre LA, Jemal A. Global cancer statistics 2018: GLOBOCAN estimates of incidence and mortality worldwide for 36 cancers in 185 countries. CA Cancer J Clin. 2018; 68:394–424. https://doi.org/10.3322/caac.21492 [PubMed]
- 2. Matsuda T, Machii R. Morphological distribution of lung cancer from Cancer Incidence in Five Continents Vol. X. Jpn J Clin Oncol. 2015; 45:404. https://doi.org/10.1093/jjco/hyv041 [PubMed]
- 3. Kourou K, Exarchos TP, Exarchos KP, Karamouzis MV, Fotiadis DI. Machine learning applications in cancer prognosis and prediction. Comput Struct Biotechnol J. 2014; 13:8–17. https://doi.org/10.1016/j.csbj.2014.11.005 [PubMed]
- 4. Lockwood WW, Wilson IM, Coe BP, Chari R, Pikor LA, Thu KL, Solis LM, Nunez MI, Behrens C, Yee J, English J, Murray N, Tsao MS, et al. Divergent genomic and epigenomic landscapes of lung cancer subtypes underscore the selection of different oncogenic pathways during tumor development. PLoS One. 2012; 7:e37775. https://doi.org/10.1371/journal.pone.0037775 [PubMed]
- 5. Wang W, Ren S, Wang Z, Zhang C, Huang J. Increased expression of TTC21A in lung adenocarcinoma infers favorable prognosis and high immune infiltrating level. Int Immunopharmacol. 2020; 78:106077. https://doi.org/10.1016/j.intimp.2019.106077 [PubMed]
- 6. Dong HX, Wang R, Jin XY, Zeng J, Pan J. LncRNA DGCR5 promotes lung adenocarcinoma (LUAD) progression via inhibiting hsa-mir-22-3p. J Cell Physiol. 2018; 233:4126–36. https://doi.org/10.1002/jcp.26215 [PubMed]
- 7. Liang J, Li H, Han J, Jiang J, Wang J, Li Y, Feng Z, Zhao R, Sun Z, Lv B, Tian H. Mex3a interacts with LAMA2 to promote lung adenocarcinoma metastasis via PI3K/AKT pathway. Cell Death Dis. 2020; 11:614. https://doi.org/10.1038/s41419-020-02858-3 [PubMed]
- 8. Multhoff G, Vaupel P. Hypoxia Compromises Anti-Cancer Immune Responses. Adv Exp Med Biol. 2020; 1232:131–43. https://doi.org/10.1007/978-3-030-34461-0_18 [PubMed]
- 9. Barsoum IB, Smallwood CA, Siemens DR, Graham CH. A mechanism of hypoxia-mediated escape from adaptive immunity in cancer cells. Cancer Res. 2014; 74:665–74. https://doi.org/10.1158/0008-5472.CAN-13-0992 [PubMed]
- 10. Salem A, Asselin MC, Reymen B, Jackson A, Lambin P, West CML, O'Connor JPB, Faivre-Finn C. Targeting Hypoxia to Improve Non-Small Cell Lung Cancer Outcome. J Natl Cancer Inst. 2018; 110:14–30. https://doi.org/10.1093/jnci/djx160 [PubMed]
- 11. Zhang B, Tang B, Gao J, Li J, Kong L, Qin L. A hypoxia-related signature for clinically predicting diagnosis, prognosis and immune microenvironment of hepatocellular carcinoma patients. J Transl Med. 2020; 18:342. https://doi.org/10.1186/s12967-020-02492-9 [PubMed]
- 12. Ritchie ME, Phipson B, Wu D, Hu Y, Law CW, Shi W, Smyth GK. limma powers differential expression analyses for RNA-sequencing and microarray studies. Nucleic Acids Res. 2015; 43:e47. https://doi.org/10.1093/nar/gkv007 [PubMed]
- 13. Ashburner M, Ball CA, Blake JA, Botstein D, Butler H, Cherry JM, Davis AP, Dolinski K, Dwight SS, Eppig JT, Harris MA, Hill DP, Issel-Tarver L, et al. Gene ontology: tool for the unification of biology. The Gene Ontology Consortium. Nat Genet. 2000; 25:25–9. https://doi.org/10.1038/75556 [PubMed]
- 14. Kanehisa M, Furumichi M, Tanabe M, Sato Y, Morishima K. KEGG: new perspectives on genomes, pathways, diseases and drugs. Nucleic Acids Res. 2017; 45:D353–61. https://doi.org/10.1093/nar/gkw1092 [PubMed]
- 15. Subramanian A, Tamayo P, Mootha VK, Mukherjee S, Ebert BL, Gillette MA, Paulovich A, Pomeroy SL, Golub TR, Lander ES, Mesirov JP. Gene set enrichment analysis: a knowledge-based approach for interpreting genome-wide expression profiles. Proc Natl Acad Sci U S A. 2005; 102:15545–50. https://doi.org/10.1073/pnas.0506580102 [PubMed]
- 16. Liberzon A, Birger C, Thorvaldsdóttir H, Ghandi M, Mesirov JP, Tamayo P. The Molecular Signatures Database (MSigDB) hallmark gene set collection. Cell Syst. 2015; 1:417–25. https://doi.org/10.1016/j.cels.2015.12.004 [PubMed]
- 17. Royston P, Altman DG. External validation of a Cox prognostic model: principles and methods. BMC Med Res Methodol. 2013; 13:33. https://doi.org/10.1186/1471-2288-13-33 [PubMed]
- 18. Wang Y, Zeng L, Liang C, Zan R, Ji W, Zhang Z, Wei Y, Tu S, Dong Y. Integrated analysis of transcriptome-wide m6A methylome of osteosarcoma stem cells enriched by chemotherapy. Epigenomics. 2019; 11:1693–715. https://doi.org/10.2217/epi-2019-0262 [PubMed]
- 19. Shen BJ, Lo WC, Lin HH. Global burden of tuberculosis attributable to cancer in 2019: Global, regional, and national estimates. J Microbiol Immunol Infect. 2022; 55:266–72. https://doi.org/10.1016/j.jmii.2021.02.005 [PubMed]
- 20. Gilkes DM, Semenza GL, Wirtz D. Hypoxia and the extracellular matrix: drivers of tumour metastasis. Nat Rev Cancer. 2014; 14:430–9. https://doi.org/10.1038/nrc3726 [PubMed]
- 21. Majmundar AJ, Wong WJ, Simon MC. Hypoxia-inducible factors and the response to hypoxic stress. Mol Cell. 2010; 40:294–309. https://doi.org/10.1016/j.molcel.2010.09.022 [PubMed]
- 22. Brahimi-Horn MC, Chiche J, Pouysségur J. Hypoxia and cancer. J Mol Med (Berl). 2007; 85:1301–7. https://doi.org/10.1007/s00109-007-0281-3 [PubMed]
- 23. Islam SMT, Won J, Khan M, Mannie MD, Singh I. Hypoxia-inducible factor-1 drives divergent immunomodulatory functions in the pathogenesis of autoimmune diseases. Immunology. 2021; 164:31–42. https://doi.org/10.1111/imm.13335 [PubMed]
- 24. Yue C, Ma H, Zhou Y. Identification of prognostic gene signature associated with microenvironment of lung adenocarcinoma. PeerJ. 2019; 7:e8128. https://doi.org/10.7717/peerj.8128 [PubMed]
- 25. Song Q, Shang J, Yang Z, Zhang L, Zhang C, Chen J, Wu X. Identification of an immune signature predicting prognosis risk of patients in lung adenocarcinoma. J Transl Med. 2019; 17:70. https://doi.org/10.1186/s12967-019-1824-4 [PubMed]
- 26. Wu X, Zhu J, Liu W, Jin M, Xiong M, Hu K. A Novel Prognostic and Predictive Signature for Lung Adenocarcinoma Derived from Combined Hypoxia and Infiltrating Immune Cell-Related Genes in TCGA Patients. Int J Gen Med. 2021; 14:10467–81. https://doi.org/10.2147/IJGM.S342107 [PubMed]
- 27. Ouyang W, Jiang Y, Bu S, Tang T, Huang L, Chen M, Tan Y, Ou Q, Mao L, Mai Y, Yao H, Yu Y, Lin X. A Prognostic Risk Score Based on Hypoxia-, Immunity-, and Epithelialto-Mesenchymal Transition-Related Genes for the Prognosis and Immunotherapy Response of Lung Adenocarcinoma. Front Cell Dev Biol. 2022; 9:758777. https://doi.org/10.3389/fcell.2021.758777 [PubMed]
- 28. Rankin EB, Giaccia AJ. Hypoxic control of metastasis. Science. 2016; 352:175–80. https://doi.org/10.1126/science.aaf4405 [PubMed]
- 29. Cheng JC, Klausen C, Leung PC. Hypoxia-inducible factor 1 alpha mediates epidermal growth factor-induced down-regulation of E-cadherin expression and cell invasion in human ovarian cancer cells. Cancer Lett. 2013; 329:197–206. https://doi.org/10.1016/j.canlet.2012.10.029 [PubMed]
- 30. Chaturvedi P, Gilkes DM, Wong CC, Luo W, Zhang H, Wei H, Takano N, Schito L, Levchenko A, Semenza GL, and Kshitiz. Hypoxia-inducible factor-dependent breast cancer-mesenchymal stem cell bidirectional signaling promotes metastasis. J Clin Invest. 2013; 123:189–205. https://doi.org/10.1172/JCI64993 [PubMed]
- 31. Matsuura K, Canfield K, Feng W, Kurokawa M. Metabolic Regulation of Apoptosis in Cancer. Int Rev Cell Mol Biol. 2016; 327:43–87. https://doi.org/10.1016/bs.ircmb.2016.06.006 [PubMed]
- 32. Tirpe AA, Gulei D, Ciortea SM, Crivii C, Berindan-Neagoe I. Hypoxia: Overview on Hypoxia-Mediated Mechanisms with a Focus on the Role of HIF Genes. Int J Mol Sci. 2019; 20:6140. https://doi.org/10.3390/ijms20246140 [PubMed]
- 33. Parks SK, Cormerais Y, Pouysségur J. Hypoxia and cellular metabolism in tumour pathophysiology. J Physiol. 2017; 595:2439–50. https://doi.org/10.1113/JP273309 [PubMed]
- 34. Meng W, Hao Y, He C, Li L, Zhu G. Exosome-orchestrated hypoxic tumor microenvironment. Mol Cancer. 2019; 18:57. https://doi.org/10.1186/s12943-019-0982-6 [PubMed]
- 35. Li L, Yang L, Fan Z, Xue W, Shen Z, Yuan Y, Sun X, Wang D, Lian J, Wang L, Zhao J, Zhang Y. Hypoxia-induced GBE1 expression promotes tumor progression through metabolic reprogramming in lung adenocarcinoma. Signal Transduct Target Ther. 2020; 5:54. https://doi.org/10.1038/s41392-020-0152-8 [PubMed]
- 36. Shi Y, Fan S, Wu M, Zuo Z, Li X, Jiang L, Shen Q, Xu P, Zeng L, Zhou Y, Huang Y, Yang Z, Zhou J, et al. YTHDF1 links hypoxia adaptation and non-small cell lung cancer progression. Nat Commun. 2019; 10:4892. https://doi.org/10.1038/s41467-019-12801-6 [PubMed]
- 37. Wang L, Pan S, Zhu B, Yu Z, Wang W. Comprehensive analysis of tumour mutational burden and its clinical significance in prostate cancer. BMC Urol. 2021; 21:29. https://doi.org/10.1186/s12894-021-00795-7 [PubMed]
- 38. Zhou CS, Feng MT, Chen X, Gao Y, Chen L, Li LD, Li DH, Cao YQ. Exonuclease 1 (EXO1) is a Potential Prognostic Biomarker and Correlates with Immune Infiltrates in Lung Adenocarcinoma. Onco Targets Ther. 2021; 14:1033–48. https://doi.org/10.2147/OTT.S286274 [PubMed]
- 39. Long J, Wang A, Bai Y, Lin J, Yang X, Wang D, Yang X, Jiang Y, Zhao H. Development and validation of a TP53-associated immune prognostic model for hepatocellular carcinoma. EBioMedicine. 2019; 42:363–74. https://doi.org/10.1016/j.ebiom.2019.03.022 [PubMed]
- 40. Tran PT, Erdeniz N, Symington LS, Liskay RM. EXO1-A multi-tasking eukaryotic nuclease. DNA Repair (Amst). 2004; 3:1549–59. https://doi.org/10.1016/j.dnarep.2004.05.015 [PubMed]
- 41. Zheng G, Zhang C, Zhong C. Identification of potential prognostic biomarkers for breast cancer using WGCNA and PPI integrated techniques. Ann Diagn Pathol. 2021; 50:151675. https://doi.org/10.1016/j.anndiagpath.2020.151675 [PubMed]
- 42. Sperka T, Wang J, Rudolph KL. DNA damage checkpoints in stem cells, ageing and cancer. Nat Rev Mol Cell Biol. 2012; 13:579–90. https://doi.org/10.1038/nrm3420 [PubMed]
- 43. Feitelson MA, Arzumanyan A, Kulathinal RJ, Blain SW, Holcombe RF, Mahajna J, Marino M, Martinez-Chantar ML, Nawroth R, Sanchez-Garcia I, Sharma D, Saxena NK, Singh N, et al. Sustained proliferation in cancer: Mechanisms and novel therapeutic targets. Semin Cancer Biol. 2015 (Suppl); 35:S25–54. https://doi.org/10.1016/j.semcancer.2015.02.006 [PubMed]
- 44. Jing X, Yang F, Shao C, Wei K, Xie M, Shen H, Shu Y. Role of hypoxia in cancer therapy by regulating the tumor microenvironment. Mol Cancer. 2019; 18:157. https://doi.org/10.1186/s12943-019-1089-9 [PubMed]
- 45. Augert A, Eastwood E, Ibrahim AH, Wu N, Grunblatt E, Basom R, Liggitt D, Eaton KD, Martins R, Poirier JT, Rudin CM, Milletti F, Cheng WY, et al. Targeting NOTCH activation in small cell lung cancer through LSD1 inhibition. Sci Signal. 2019; 12:eaau2922. https://doi.org/10.1126/scisignal.aau2922 [PubMed]
- 46. Tan AC. Targeting the PI3K/Akt/mTOR pathway in non-small cell lung cancer (NSCLC). Thorac Cancer. 2020; 11:511–8. https://doi.org/10.1111/1759-7714.13328 [PubMed]
- 47. Hua Q, Jin M, Mi B, Xu F, Li T, Zhao L, Liu J, Huang G. LINC01123, a c-Myc-activated long non-coding RNA, promotes proliferation and aerobic glycolysis of non-small cell lung cancer through miR-199a-5p/c-Myc axis. J Hematol Oncol. 2019; 12:91. https://doi.org/10.1186/s13045-019-0773-y [PubMed]
- 48. Niu J, Sun Y, Chen B, Zheng B, Jarugumilli GK, Walker SR, Hata AN, Mino-Kenudson M, Frank DA, Wu X. Fatty acids and cancer-amplified ZDHHC19 promote STAT3 activation through S-palmitoylation. Nature. 2019; 573:139–43. https://doi.org/10.1038/s41586-019-1511-x [PubMed]