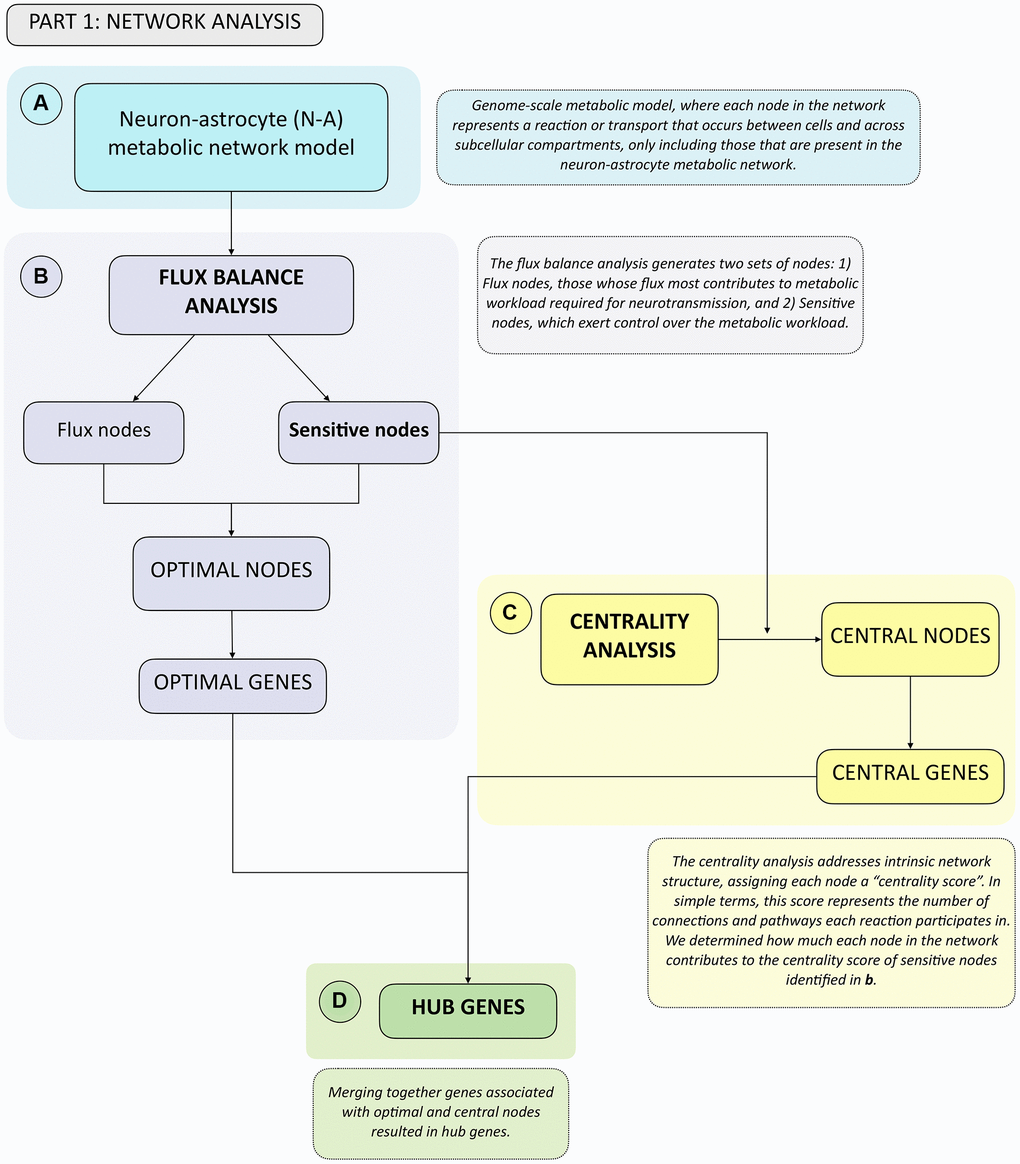
Figure 1.Summary flowchart of network analyses depicting how optimal and central genes were identified, which merged together form the hub genes group. (A) A genome-scale metabolic model from Lewis et al., 2010 was used. This network was analyzed first using. (B) Flux Balance Analysis, from which Flux and Sensitive Nodes were identified. Merging these two node lists yielded Optimal Nodes, from which Optimal Genes were identified. Sensitive Nodes were then analyzed using. (C) Centrality Analysis, which allowed identifying Central Nodes, from which Central Genes were identified. Merging the list of Optimal and Central Genes produced the Hub Genes list. (D) See boxes in dashed lines for the explanation of each type of analysis.