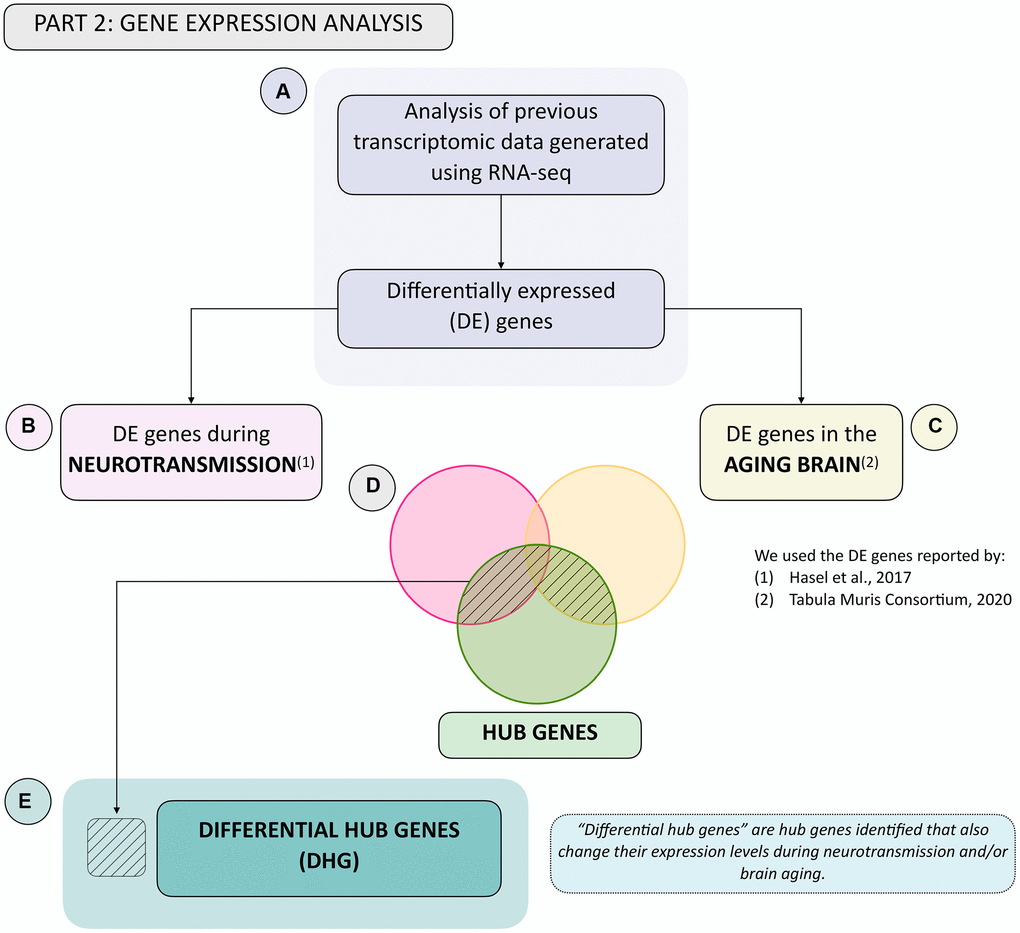
Figure 2.Summary flowchart of integration of hub genes with transcriptomic data generated during neurotransmission and brain aging. (A) Transcriptomic data during neurotransmission (Hasel et al., 2017) and aging (Tabula Muris Consortium, 2020), reporting differentially expressed genes during each process in the neuron and/or astrocyte was obtained. This allowed us to obtain a list of differentially expressed (DE) genes in both cell types during. (B) neurotransmission and/or (C) brain aging. (D) Venn diagram showing common genes: (1) Between DE genes during neurotransmission and hub genes (pink and green sets); (2) Between DE genes during brain aging and hub genes (yellow and green sets), and (3) The intersection between all three gene groups (pink, yellow and green sets). (E) The differential hub genes (DHG) list is shown in (D) in the shaded area.