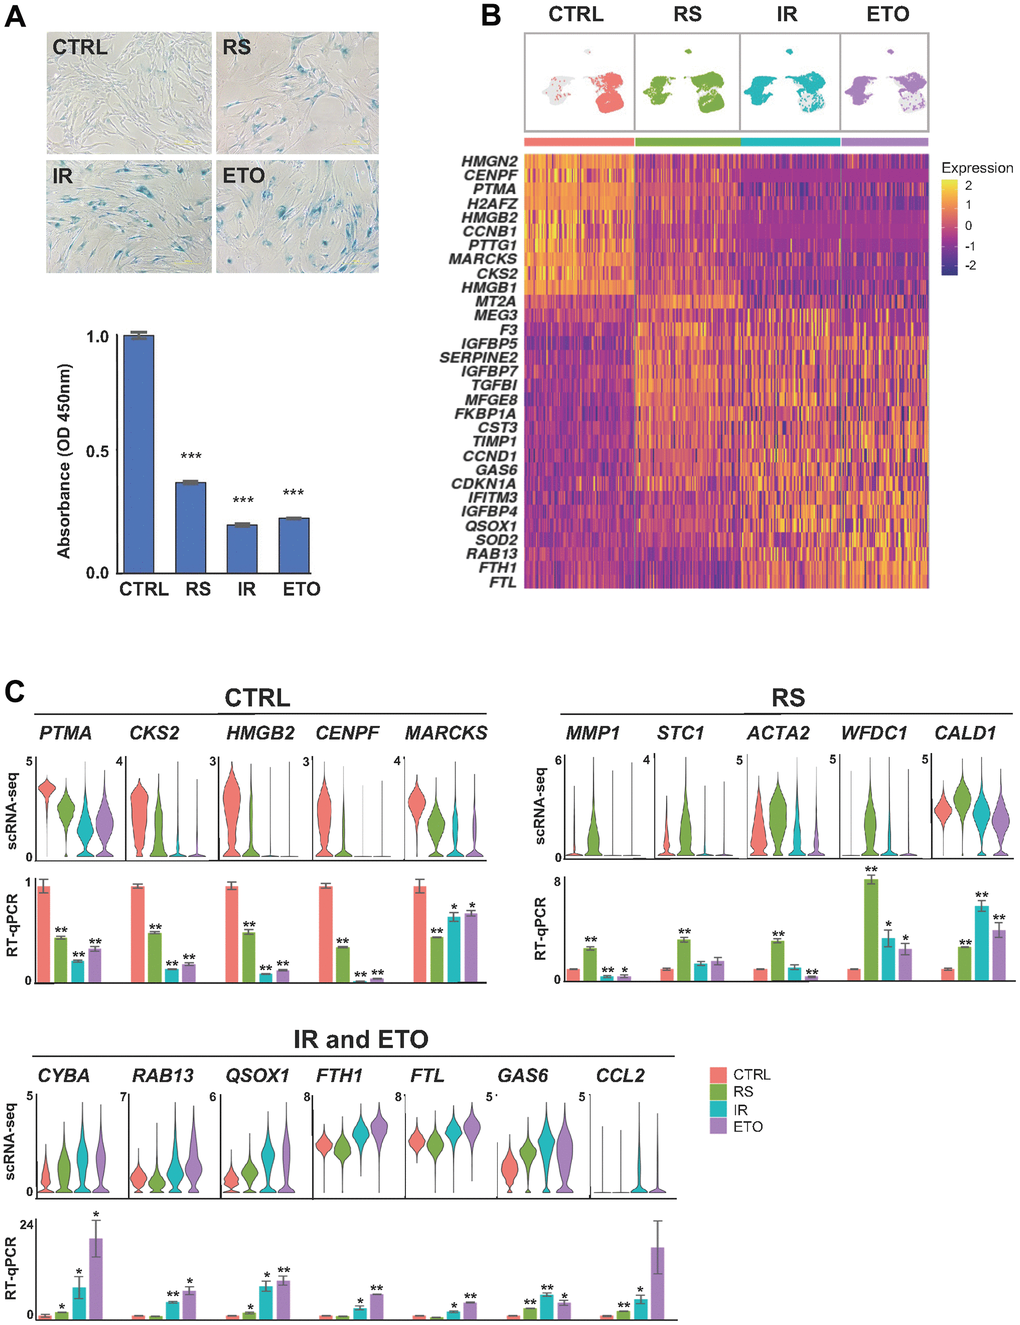
Figure 1.Shared and distinct transcriptomes of WI-38 fibroblasts in different senescence models. (A) WI-38 fibroblasts that were proliferating at PDL 24 (CTRL), cultured until replicative exhaustion at PDL 57 (RS), exposed to 10 Gy of ionizing radiation and cultured for an additional 10 days (IR), or cultured for six days in media containing 50 μM of etoposide and in regular media for another four days (ETO), were analyzed for SA-β-Gal activity (top), and proliferation rates evaluated by measuring by BrdU incorporation (bottom) and compared to the CTRL population. (B) Top, UMAP plots with distribution of cells that were color-coded for each group. Bottom, heatmap showing the relative expression of top marker mRNAs in each population. (C) The expression levels of representative top markers from scRNA-seq data (top) were validated by RT-qPCR analysis (bottom). The relative levels of each mRNA in CTRL, RS, IR, and ETO were first normalized to GAPDH mRNA levels and each senescence model was compared to CTRL cells. In (A, C) significance was assessed by two-tailed unpaired Student’s t-test, n = 2, *p < 0.05, **p < 0.01, ***p < 0.001.