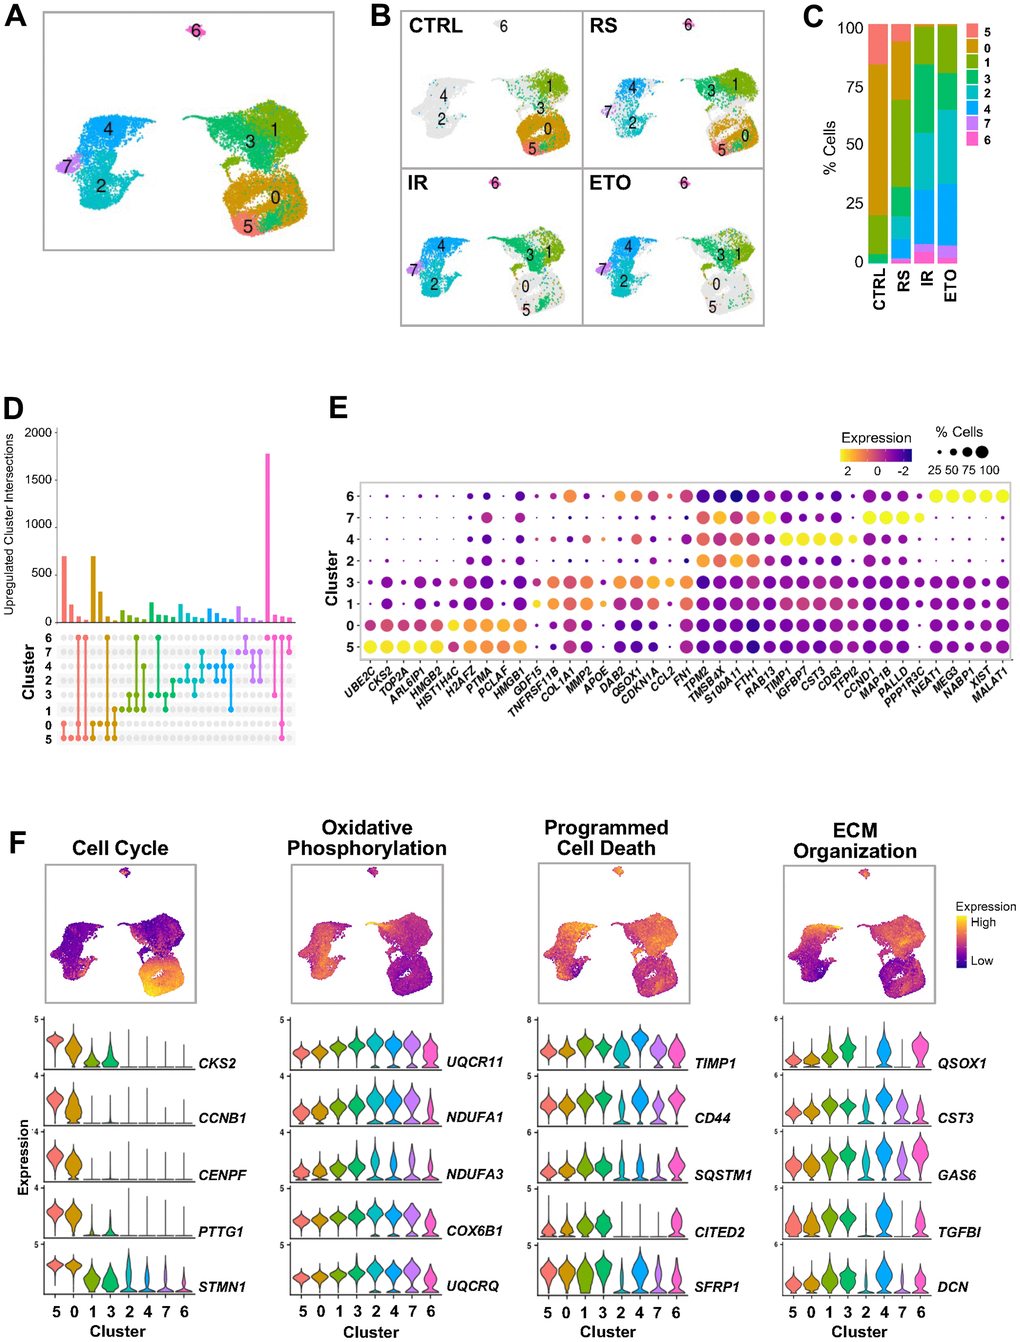
Figure 2.Clustering analysis of integrated single-cell senescence models. (A) UMAP illustrating the cell clusters with different gene expression profiles, distinguished by unsupervised clustering of integrated samples from Figure 1. (B) Distribution of cell clusters from (A) in each sample analyzed. (C) Percent composition of cell clusters from (B) in each sample. (D) Overlap of upregulated RNA sets among clusters. Set size: number of upregulated RNAs in each cluster. Each column shows number of genes encoding RNAs that are either unique for one cluster (single dot) or shared by clusters (dots connected by lines). (E) Top highest expressed marker RNAs in each cluster. Dot color represents average gene expression levels scaled across all clusters, and dot size indicates percentage of cells expressing specific gene in each cluster. Clusters are ordered by similarity of the transcriptomes in (A). (F) Select GO terms of GSEA performed for each cluster (Supplementary Figure 1B). Cells are colored by gene expression signature scores of indicated GO terms assessed for each cell and presented in UMAP space (top). Violin plots show expression levels of RNAs from top genes contributing to scoring across all clusters (bottom).