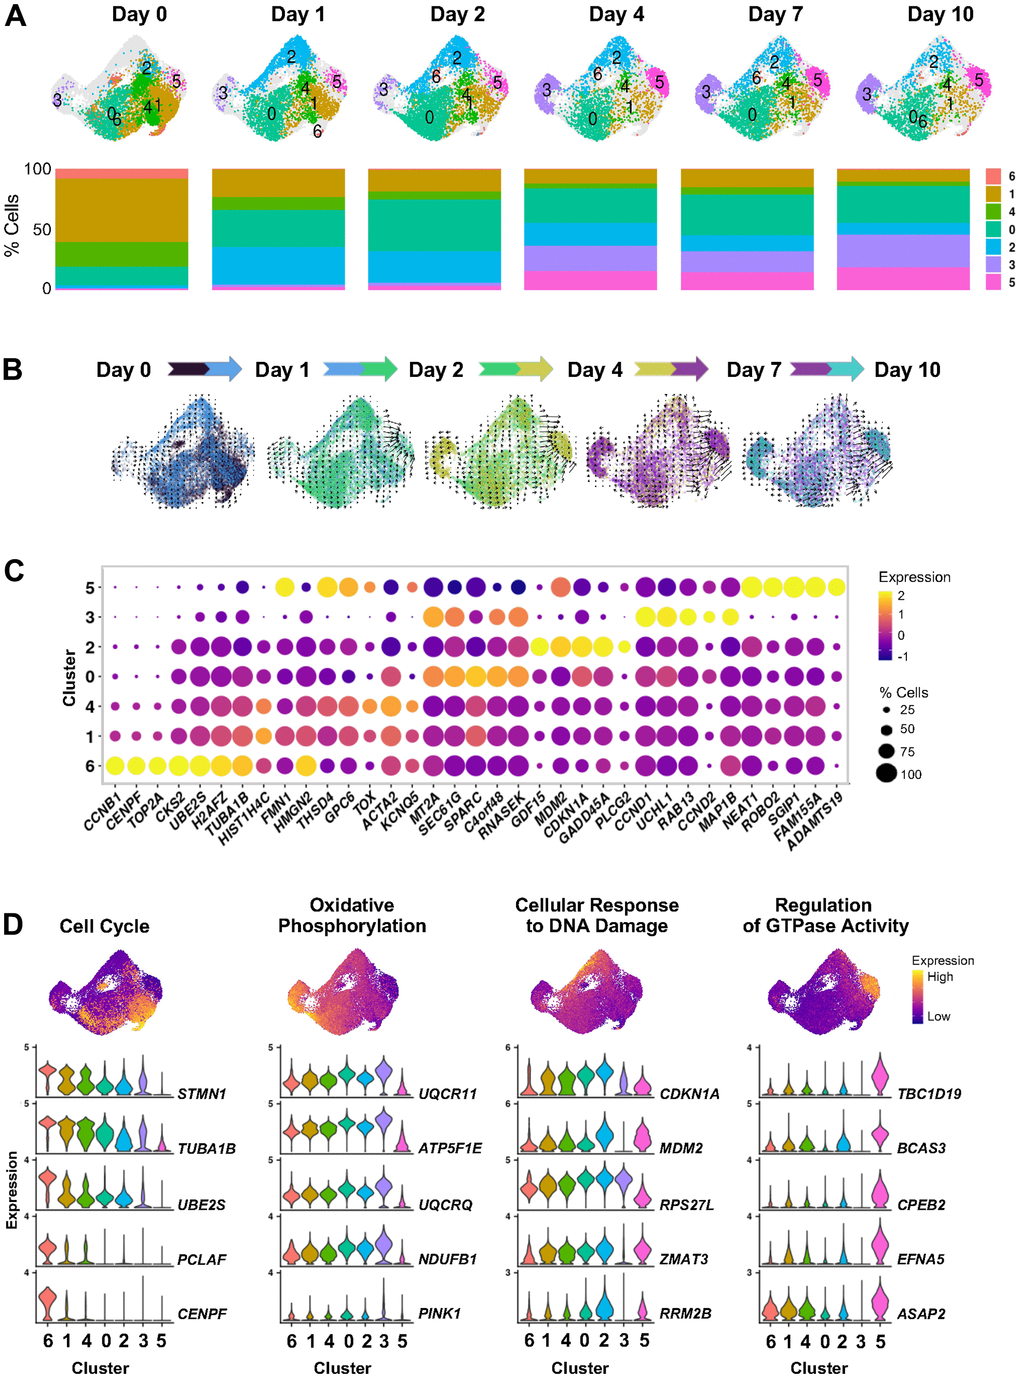
Figure 3.Cell states evolving over time after ETO-induced senescence. (A) UMAP plots illustrating changes in the distribution of cell clusters identified by scRNA-seq analysis at the indicated time points after beginning treatment with 50 μM ETO added to the culture media (top). Percent composition of cell clusters in each time point during ETO treatment (bottom). (B) RNA velocity projected onto the UMAP plot illustrating the direction of transitions among cell clusters. To preserve the temporal variations in trajectories, velocity estimates were calculated in paired contiguous samples. The color dots indicate cells in each pair of time points. Arrow length indicates the estimated rate of transcriptomic changes and arrowhead shows predicted direction of these changes. (C) Most highly expressed marker RNAs in each cluster. Dot color represents average RNA expression levels scaled across all clusters and dot size indicates percentage of cells expressing a specific RNA in each cluster. Clusters are ordered by similarity of the transcriptomes of cells in (A). (D) Select GO terms from Supplementary Figure 1C. Cells are colored by transcriptomic signature scores of indicated GO terms assessed for each cell and presented in UMAP space (top). Violin plots show the expression patterns of top RNAs contributing to scoring across all clusters (bottom).