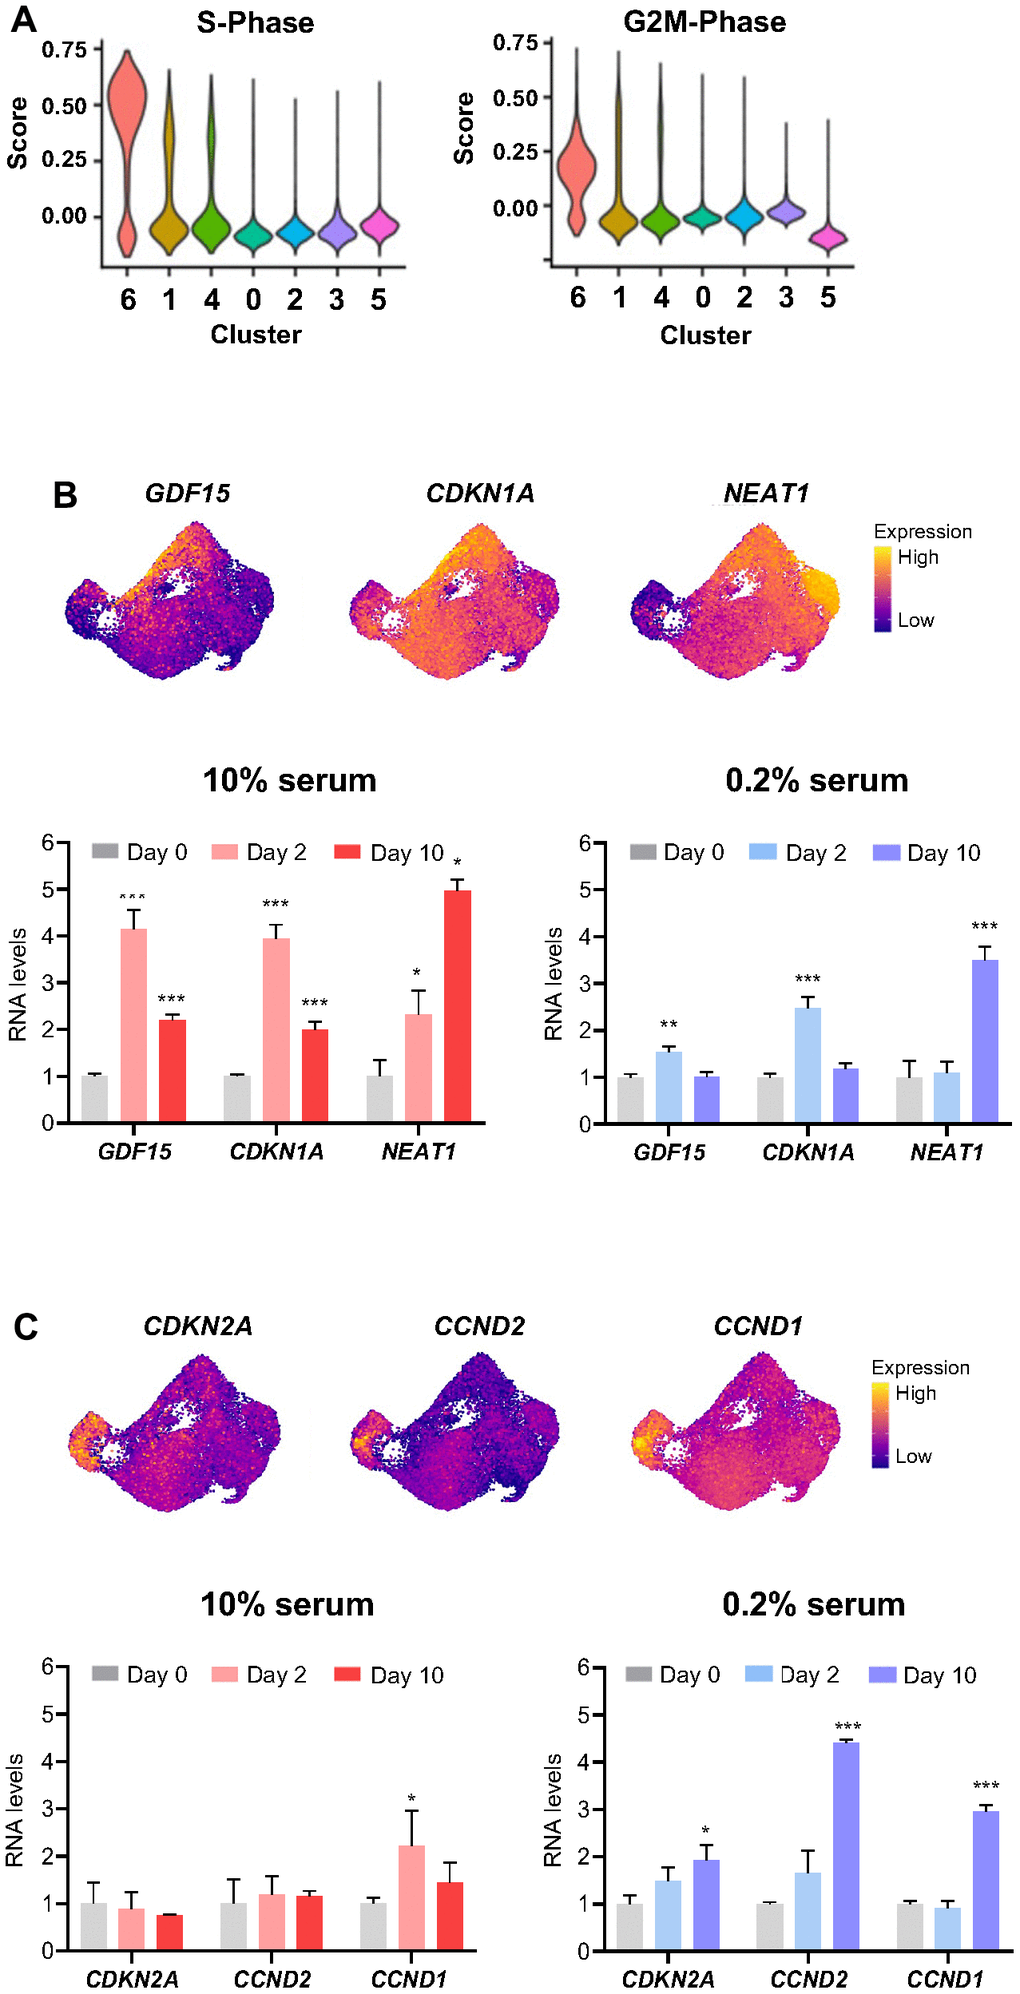
Figure 4.Influence of cell proliferative status on transcriptomic response to ETO treatment. (A) Cell cycle states of ETO time course cell clusters determined by the ‘CellCycleScoring’ function in Seurat. (B, C) Relative levels of select RNAs upregulated in cluster 2 (B), and cluster 3 (C) compared to the rest of the cells (top). The expression levels of RNAs shown (top) after ETO treatment (Day 2, Day 10) in cells cultured in 10% or 0.2% serum media were quantified by RT-qPCR analysis (bottom). Relative RNA levels were normalized to GAPDH mRNA levels and compared to untreated cells (Day 0). Significance was assessed by two-tailed unpaired Student’s t-test, n = 3, *p < 0.05, **p < 0.01, ***p < 0.001.