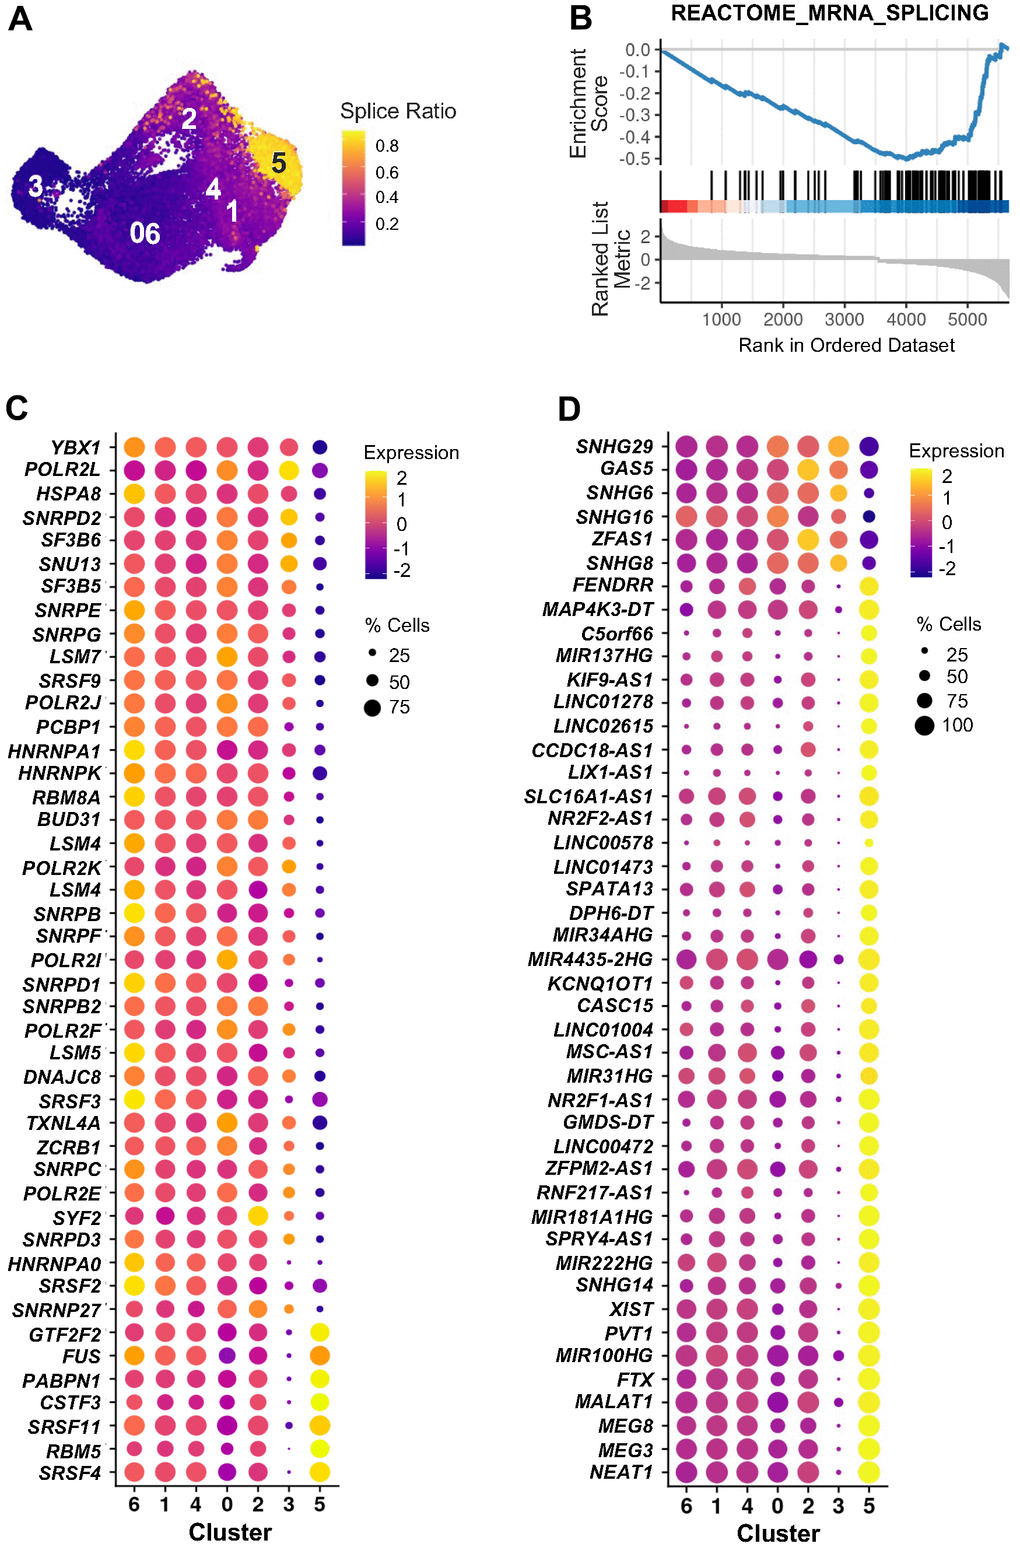
Figure 6.RNA splicing and lncRNAs in cluster 5 of ETO time course. (A) Splice ratio illustrating increased unspliced RNAs in cluster 5. Splice ratio for individual cells was calculated as the number of unspliced transcripts relative to total RNA content. (B) GSEA enrichment plot of “REACTOME_MRNA_SPLICING” gene set in cluster 5 in comparison to all other cells. Normalized enrichment score NES = -2.42, adjusted p-value < 0.001. (C) Top 45 mRNAs encoding splicing-associated proteins identified by GSEA in (B) that showed greatest difference in expression between cluster 5 and all other cells. (D) Top 45 lncRNAs showing greatest changes of expression in cluster 5 compared to the rest of cells. In (C, D) dot color represents average RNA levels scaled across all clusters and dot size indicates percentage of cells expressing the specific RNAs in each cluster.