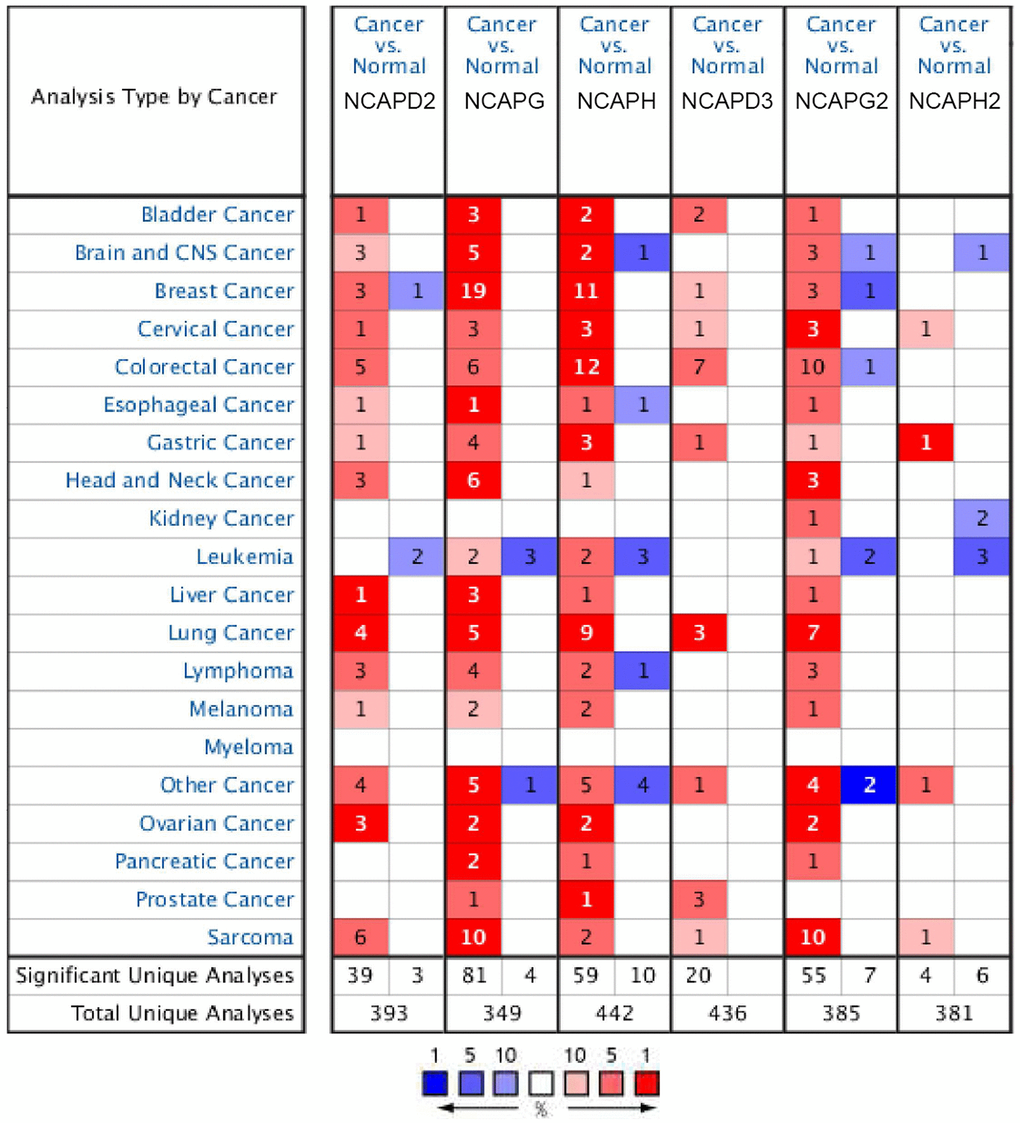
Figure 2.The expression levels of NCAP genes in different types of human cancers and normal samples. The red cells represent evidence of gene overexpression. The blue cells represent evidence of reduced gene expression. The numbers in each cell represent the evidential frequencies. The deeper the color, the higher the significance.