


Introduction
Sarcoma is a set of mesenchymal and heterogeneous neoplasms, which principally is grouped into primary osteosarcoma and soft tissue sarcoma and contains beyond 100 different diagnostic entities [1]. Several causative factors of sarcoma have been identified, including Germline mutations, radiation, and carcinogens [2]. Osteosarcoma in adolescents is the most frequent occurrence of primary malignant bone tumor [3] and has an undesirable mortality rate. [4]. The 5-year survival rate is relatively low, about 60%–70% [5], and the 5-year survival rate of patients with metastatic osteosarcoma is only 19–30% [6]. Even with the progress of surgical and auxiliary treatment, the molecular mechanism of sarcoma needs to be further explored [7, 8].
Condensins participate in cell mitosis and meiosis in the human cell cycle [9]. Condensins are involved in chromosome aggregation and separation in the cell cycle [10]. There are two kinds of condensins in human cells, condensin I and condensin II [11]. Condensin I complex comprises three non-SMC subunits and structural maintenance of chromosomes (SMC) proteins [12]. Three non-SMC subunits are named non-SMC condensin I complex H subunit (NCAPH), non-SMC condensin I complex G subunit (NCAPG), and non-SMC condensin I complex D2 subunit (NCAPD2) separately [13]. Condensin II complex combines with enhancer and promoter during DNA transcription and can regulate the expression of genes [14, 15]. Non-SMC condensin I complex H subunit (NCAPH), non-SMC condensin I complex G subunit (NCAPG2) and non-SMC condensin I complex D2 subunit (NCAPD3) are subunits of condensins II [16, 17].
Up to now, NCAPD2, NCAPG, NCAPH, NCAPD3, NCAPG2, and NCAPH2 have not been mentioned in sarcoma, except NCAPG mentioned in Ewing sarcoma [18]. In this study, ONCOMINE, GEPIA, Kaplan-Meier plotter, DAVID (KEGG and GO analysis), and TIMER datasets were utilized to study the high expression, prognosis analysis, signal pathway and immune correlation of NCAPD2, NCAPG, NCAPH, NCAPD3, NCAPG2, and NCAPH2 in sarcoma for the first time (Figure 1). NCAP family genes are expected to become early prognostic biomarkers of sarcoma patients.
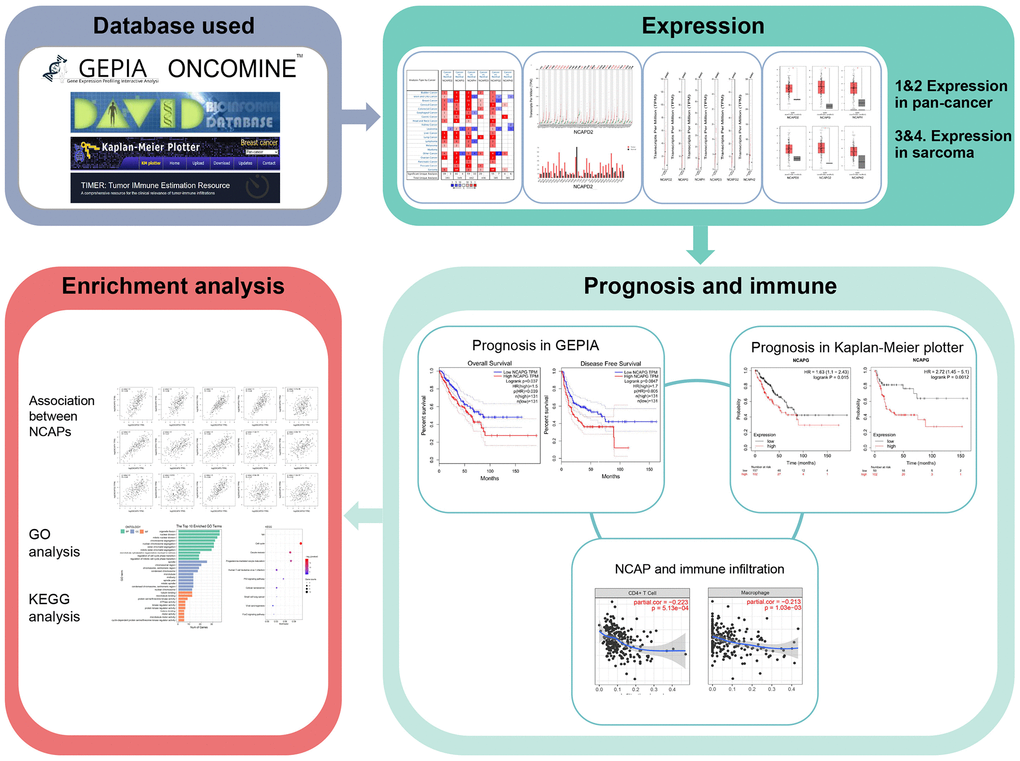
Figure 1. Flow chart of the study.
Results
Transcriptional levels of NCAPs in sarcoma patients
In our research, differential expression levels of NCAPs between normal tissues and cancer tissues were analyzed by ONCOMINE and GEPIA databases. Six members of the NCAPs family, including NCAPD2, NCAPG, NCAPH, NCAPD3, NCAPG2, and NCAPH2, have been found in different types of sarcomas. All of them were upregulated in sarcoma samples compared to normal tissues in 2 databases (Figure 2).
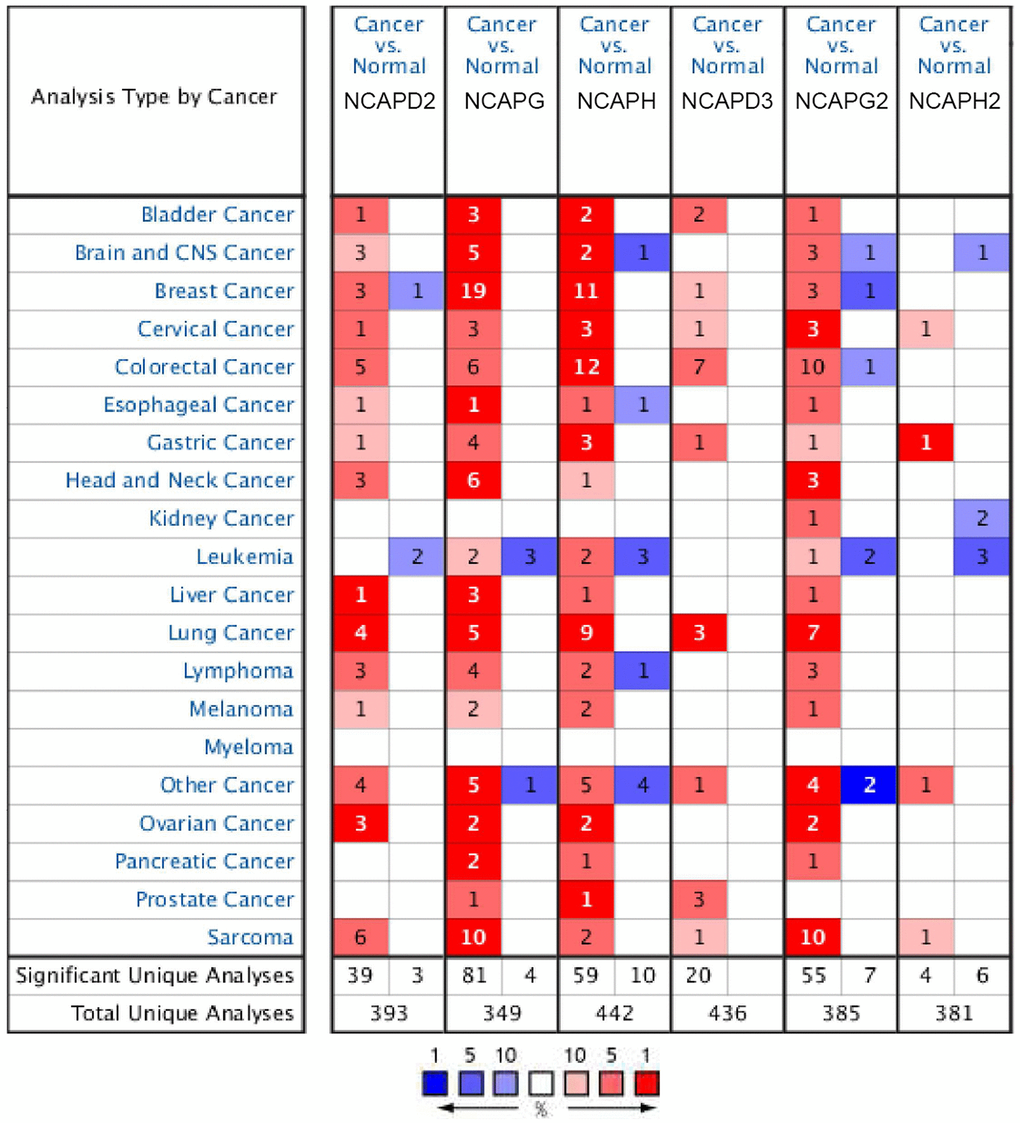
Figure 2. The expression levels of NCAP genes in different types of human cancers and normal samples. The red cells represent evidence of gene overexpression. The blue cells represent evidence of reduced gene expression. The numbers in each cell represent the evidential frequencies. The deeper the color, the higher the significance.
Firstly, in Detwiller Sarcoma dataset, NCAPD2 was overexpressed in Maligant Fibrous Histiocytoma, Fibrosarcoma and Leiomyosarcoma with 2.866 (p = 4.03E-6), 2.661 (p = 1.25E-4) and 2.690 (p = 0.002) fold changes. NCAPG was upregulated in Leiomyosarcoma, Pleomorphic Liposarcoma, Fibrosarcoma, Malignant Fibrous Histiocytoma, Round Cell Liposarcoma and Synovial Sarcoma. The fold changes of these sarcomas were as follows: 41.047 (p = 4.10E-10), 53.462 (p = 4.87E-10), 40.123 (p = 7.77E-10), 47.334 (p = 2.31E-10), 27.533 (5.79E-9) and 18.076 (8.4E-7). NCAPH was upregulated in Malignant Fibrous Histiocytoma and Fibrosarcoma with fold changes of 11.886 (p = 5.22E-6) and 10.772 (p = 7.72E-5). NCAPD3 was upregulated in Round Cell Liposarcoma with a fold change of 2.213 (p = 0.003). NCAPG2 was upregulated in Pleomorphic Liposarcoma, Leiomyosarcoma, Malignant Fibrous Histiocytoma, Fibrosarcoma, Dedifferentiated Liposarcoma, Synovial Sarcoma, and Round Cell Liposarcoma. The fold changes were as follows: 11.472 (p = 3.13E-6), 9.095 (p = 1.28E-6), 8.265 (p = 2.05E-6), 6.340 (p = 1.30E-5), 3.671 (p = 0.002), 5.076 (p = 5.20E-5) and 5.645 (p = 2.72E-4). NCAPH2 was upregulated in Round Cell Liposarcoma with a fold change of 2.013 (p = 0.002). In the Barretina Sarcoma dataset, NCAPD2 was overexpressed in Myxofibrosarcoma, Pleomorphic Liposarcoma, and Leiomyosarcoma with 2.627 (p = 4.43E-9), 2.118 (p = 1.21E-6) and 2.361 (p = 9.55E-8) fold changes. NCAPG was upregulated in Myxofibrosarcoma, Pleomorphic Liposarcoma, and Leiomyosarcoma with 3.118 (p = 4.55E-14), 3.051 (p = 7.64E-10) and 2.633 (P = 6.60E-8) fold changes. NCAPG2 was upregulated in Pleomorphic Liposarcoma, Leiomyosarcoma, and Myxofibrosarcoma with 2.388 (p = 1.98E-8), 2.540 (p = 1.69E-9) and 2.175 (p = 1.36E-9) fold changes (Table 1).
Table 1. The significant changes of NCAPs expression in transcription level between different types of sarcoma.
| Gene ID | Types of sarcoma vs. Normal | Fold change | p Value | t Test | References |
| NCAPD2 | Malignant Fibrous Histiocytoma vs. Normal | 2.866 | 4.03E-6 | 6.926 | Detwiller Sarcoma |
| Fibrosarcoma vs. Normal | 2.661 | 1.25E-4 | 5.742 | Detwiller Sarcoma | |
| Leiomyosarcoma vs. Normal | 2.690 | 0.002 | 4.291 | Detwiller Sarcoma | |
| Myxofibrosarcoma vs. Normal | 2.627 | 4.43E-9 | 8.927 | Barretina Sarcoma | |
| Pleomorphic Liposarcoma vs. Normal | 2.118 | 1.21E-6 | 5.938 | Barretina Sarcoma | |
| Leiomyosarcoma vs. Normal | 2.361 | 9.55E-8 | 6.805 | Barretina Sarcoma | |
| NCAPG | Leiomyosarcoma vs. Normal | 41.047 | 4.10E-10 | 11.716 | Detwiller Sarcoma |
| Pleomorphic Liposarcoma vs. Normal | 53.462 | 4.87E-10 | 13.338 | Detwiller Sarcoma | |
| Fibrosarcoma vs. Normal | 40.123 | 7.77E-10 | 10.439 | Detwiller Sarcoma | |
| Malignant Fibrous Histiocytoma vs. Normal | 47.334 | 2.31E-10 | 10.536 | Detwiller Sarcoma | |
| Round Cell Liposarcoma vs. Normal | 27.533 | 5.79E-9 | 10.209 | Detwiller Sarcoma | |
| Synovial Sarcoma vs. Normal | 18.076 | 8.40E-7 | 7.926 | Detwiller Sarcoma | |
| Myxofibrosarcoma vs. Normal | 3.118 | 4.55E-14 | 11.534 | Barretina Sarcoma | |
| Pleomorphic Liposarcoma vs. Normal | 3.051 | 7.64E-10 | 9.116 | Barretina Sarcoma | |
| Leiomyosarcoma vs. Normal | 2.633 | 6.60E-8 | 7.124 | Barretina Sarcoma | |
| NCAPH | Malignant Fibrous Histiocytoma vs. Normal | 11.886 | 5.22E-6 | 7.869 | Detwiller Sarcoma |
| Fibrosarcoma vs. Normal | 10.722 | 7.72E-5 | 6.961 | Detwiller Sarcoma | |
| NCAPD3 | Round Cell Liposarcoma vs. Normal | 2.213 | 0.003 | 3.265 | Detwiller Sarcoma |
| NCAPG2 | Pleomorphic Liposarcoma vs. Normal | 11.472 | 3.13E-6 | 7.015 | Detwiller Sarcoma |
| Leiomyosarcoma vs. Normal | 9.095 | 1.28E-6 | 7.015 | Detwiller Sarcoma | |
| Malignant Fibrous Histiocytoma vs. Normal | 8.265 | 2.05E-6 | 6.320 | Detwiller Sarcoma | |
| Fibrosarcoma vs. Normal | 6.340 | 1.30E-5 | 5.504 | Detwiller Sarcoma | |
| Dedifferentiated Liposarcoma vs. Normal | 3.671 | 0.002 | 3.419 | Detwiller Sarcoma | |
| Synovial Sarcoma vs. Normal | 5.076 | 5.20E-5 | 5.050 | Detwiller Sarcoma | |
| Round Cell Liposarcoma vs. Normal | 5.645 | 2.72E-4 | 4.529 | Detwiller Sarcoma | |
| Pleomorphic Liposarcoma vs. Normal | 2.388 | 1.98E-8 | 7.478 | Barretina Sarcoma | |
| Leiomyosarcoma vs. Normal | 2.540 | 1.69E-9 | 8.105 | Barretina Sarcoma | |
| Myxofibrosarcoma vs. Normal | 2.175 | 1.36E-9 | 7.718 | Barretina Sarcoma | |
| NCAPH2 | Round Cell Liposarcoma vs. Normal | 2.013 | 0.002 | 3.252 | Detwiller Sarcoma |
By evaluating NCAPs in normal and sarcoma tissues using the GEPIA database, we noticed significantly higher expression patterns of NCAPD2, NCAPG, NCAPH, NCAPG2, and in sarcoma samples compared to normal tissues. NCAPD3 and NCAPH2 were also upregulated in sarcoma samples but with no significance (Figure 3).
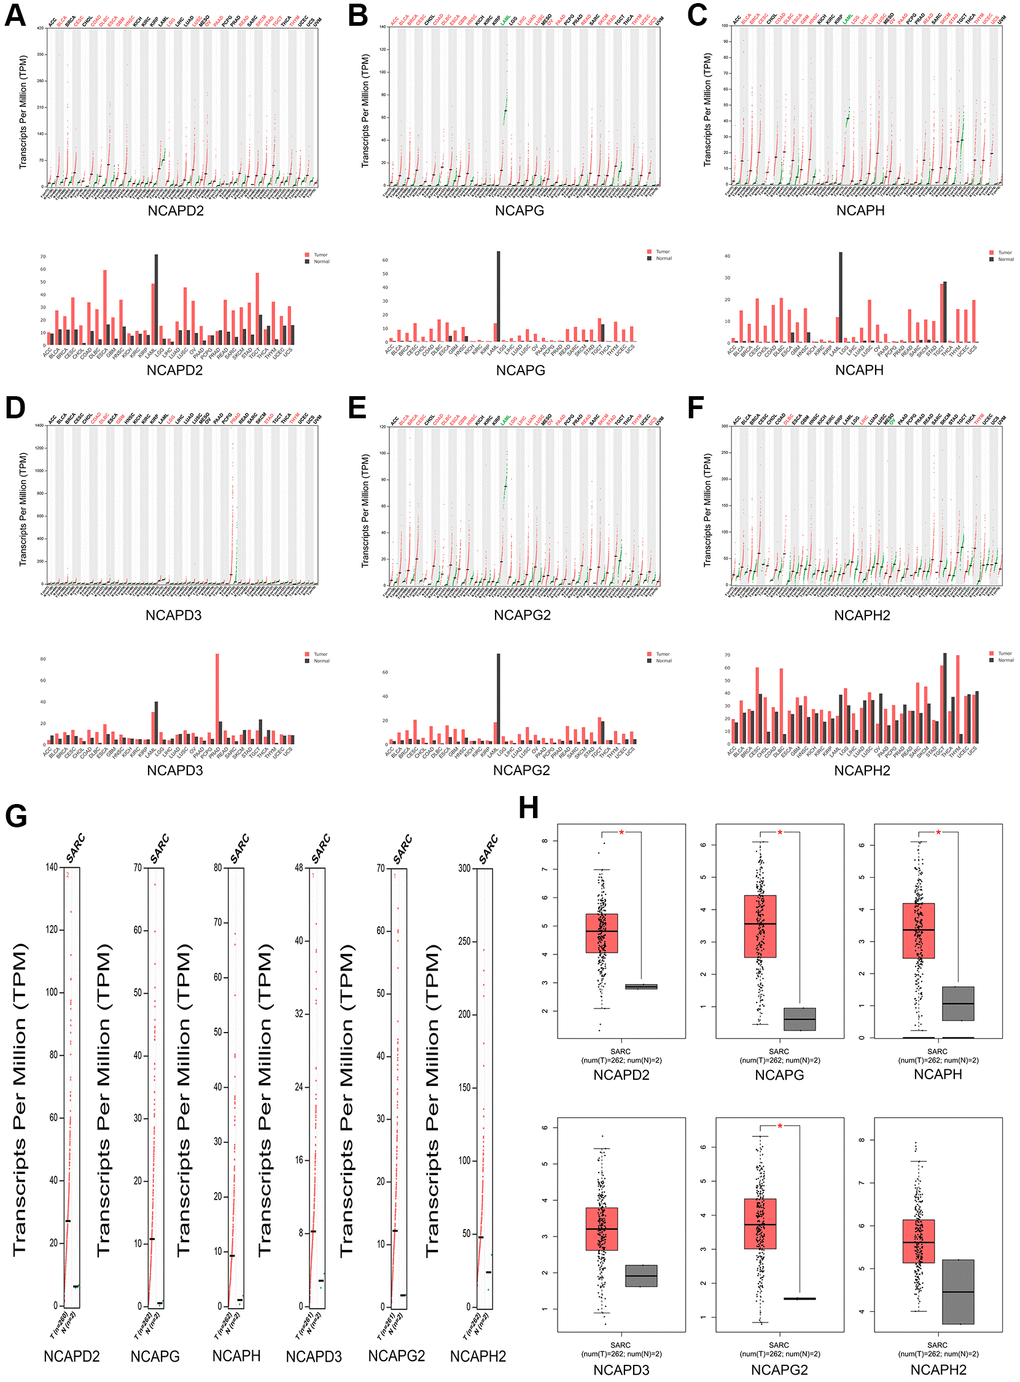
Figure 3. The expression levels of NCAP genes in sarcoma. (A–F) The expression levels of NCAPD2, NCAPG, NCAPD3, NCAPG2, NCAPH, and NCAPH2 in pan-cancer, (G, H) The expression levels of NCAP genes in sarcoma. Each dot represents an individual sample, *P < 0.05.
The prognostic value of high expression of NCAPs in sarcoma
We investigated the clinical prognostic value of NCAPs in sarcoma using the Kaplan-Meier Plotter and GEPIA databases and obtained survival data for patients with sarcoma. GEPIA database showed that high expression of NCAPD2, NCAPH, NCAPG and NCAPG2 had a significant correlation with poor overall survival of sarcoma patients (P < 0.05). The high expression of NCAPD3 and NCAPH2 were also associated with poor overall survival but there was no statistical significance (P > 0.05). The overall survival hazard ratios of NCAPD2, NCAPG, NCAPH, and NCAPG2 were 1.8 (P = 0.0028), 1.5 (P = 0.037), 1.6 (P = 0.03) and 1.5 (P = 0.043) respectively (Figure 4A). The Figure 4B showed that high expression levels of NCAPD2, NCAPG, and NCAPH were significantly correlated with the poor disease free survival of sarcoma patients. The disease free survival hazard ratios of NCAPD2, NCAPG, and NCAPH were 1.9 (P = 0.00047), 1.7 (P = 0.0047), and 1.5 (P = 0.032), respectively.
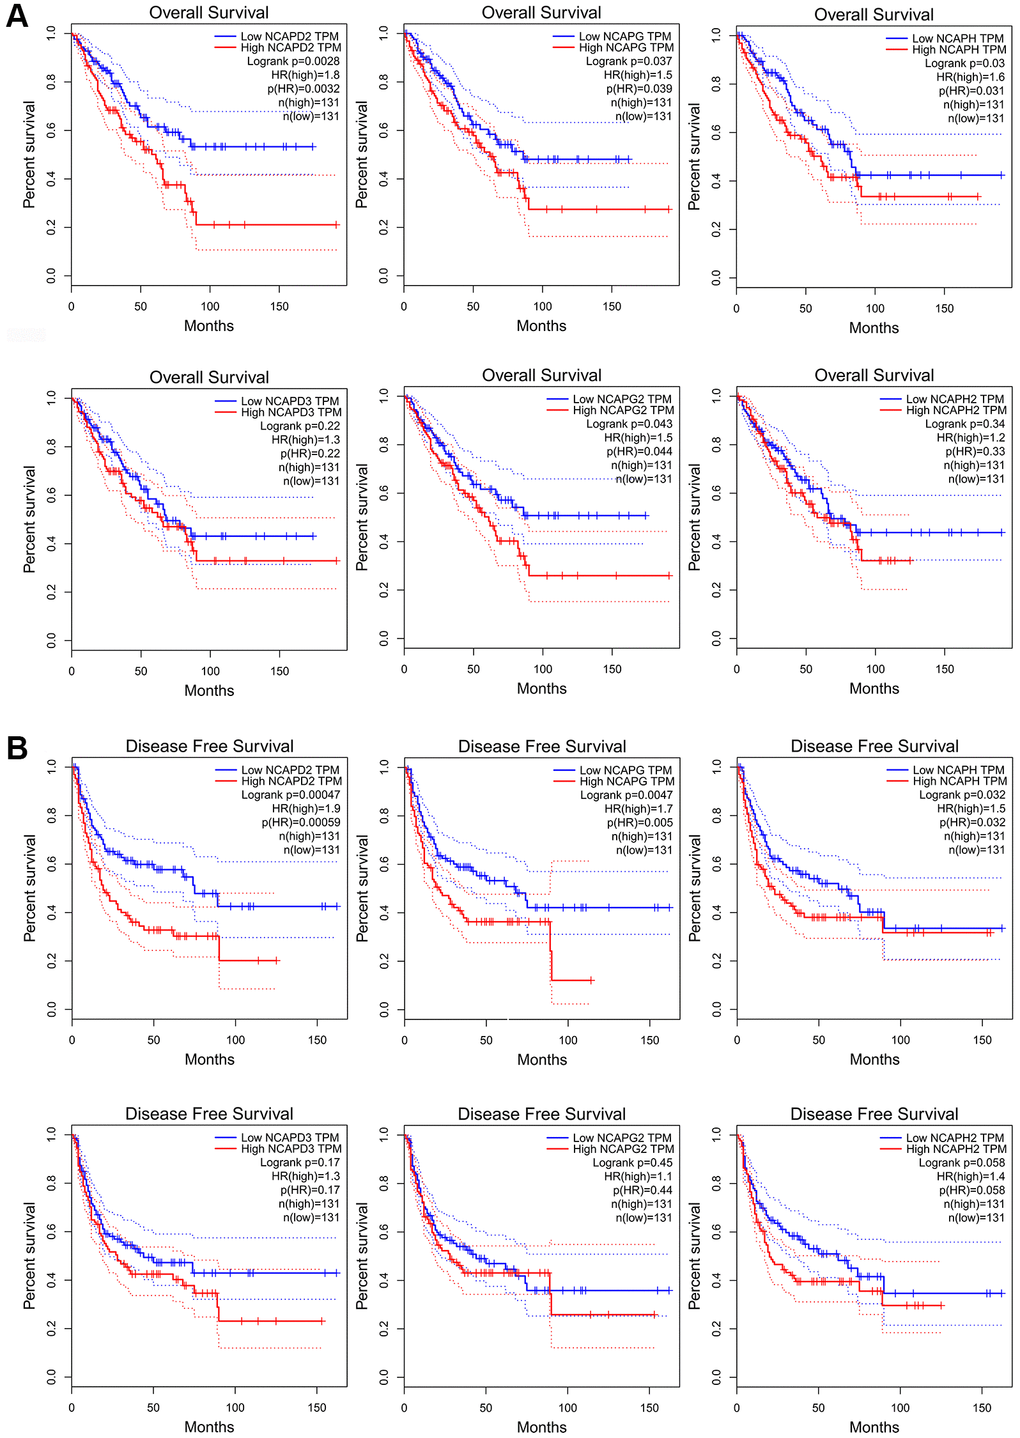
Figure 4. The prognostic value of mRNA level of NCAP factors in sarcoma patients. Higher expression of NCAP genes is associated with worse (A) overall survival and (B) disease-free survival. Abbreviation: HR: hazard ratio.
In the Kaplan-Meier Plotter database, high expression of NCAPD2, NCAPG, NCAPH, and NCAPD3 was correlated with poor overall survival in sarcoma patients (p < 0.05), HR = 2.23 (p = 0.00016), 1.63 (p = 0.015), 1.83 (p = 0.0025), and 1.63 (p = 0.024), respectively (Figure 5A). The high expression of NCAPD2, NCAPG, NCAPH, NCAPD3, and NCAPH2 were all correlated with the relapse-free survival of sarcoma patients, HR = 2.76 (p = 3.3e-05), 2.72 (p = 0.0012), 2.71 (p = 0.0026), 1.87 (p = 0.01) and 2.08 (p = 0.029) respectively (Figure 5B). In addition, the high expression of NCAPG2 was also correlated with the poor overall survival and disease-free survival of sarcoma patients, but with no significance (p > 0.05). The high expression of NCAPH2 was correlated with poor overall survival of sarcoma patients but had no statistical significance (p > 0.05).
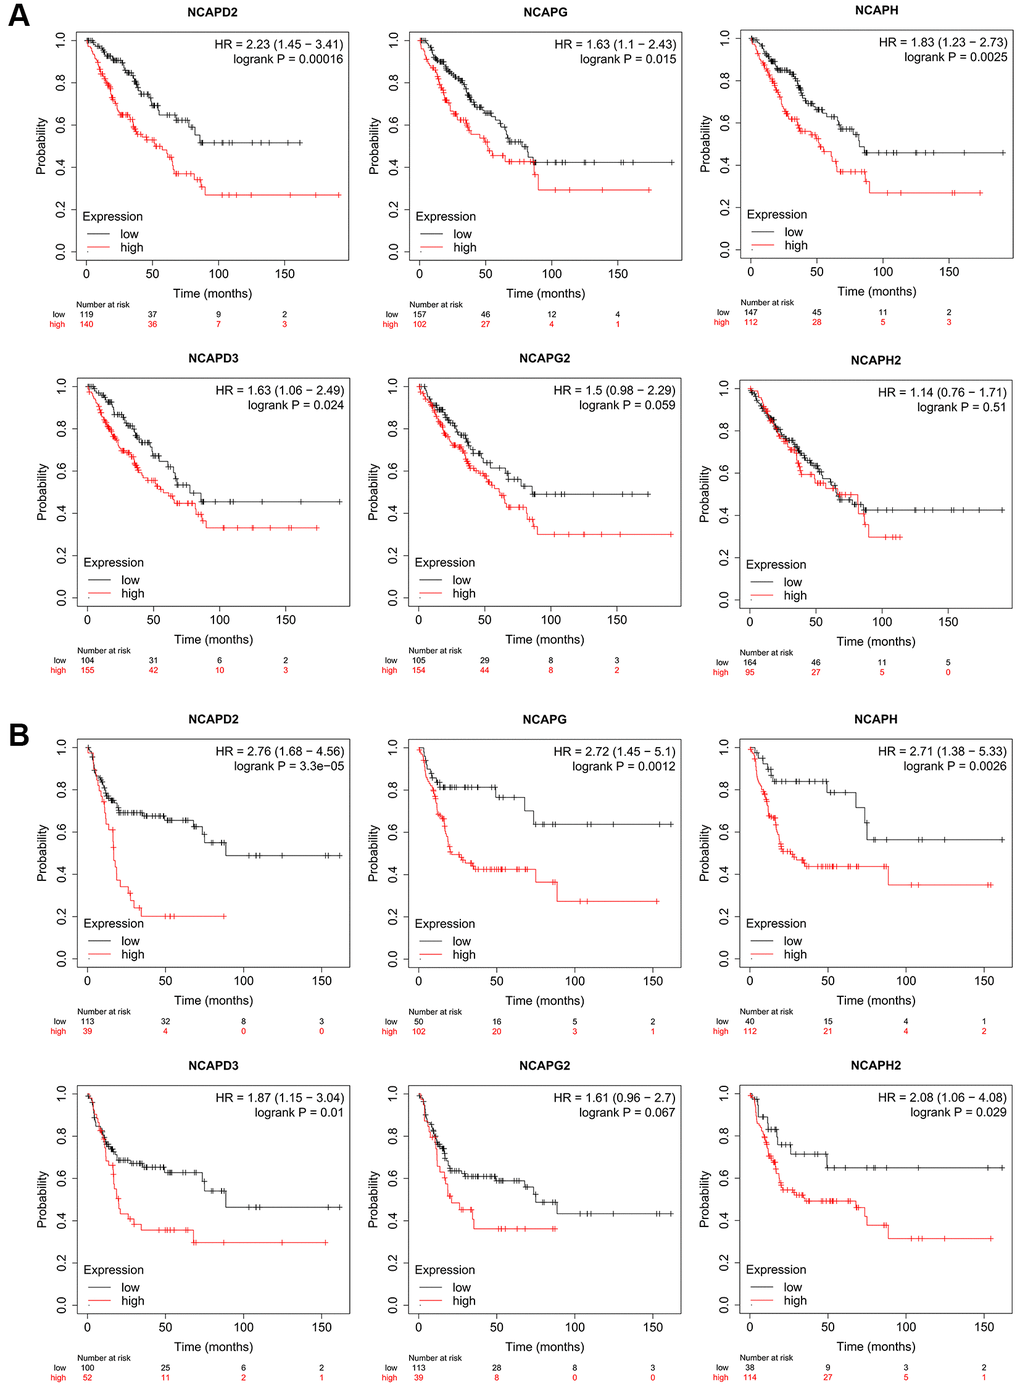
Figure 5. The prognostic value of mRNA level of NCAP factors in sarcoma patients. The prognostic value of mRNA level of NCAP factors in sarcoma patients was analyzed by Kaplan Meier Plotter. Expression of NCAP family genes was related to poor (A) overall survival and (B) relapse-free survival in sarcoma.
Association between NCAP genes
The present study investigated the association between the expression of NCAPD2, NCAPG, NCAPH, NCAPD3, NCAPG2, and NCAPH2 by using the GEPIA database. The study found that there were positive correlations between NCAPD2 and NCAPG (R = 0.58 p < 0.05), NCAPH and NCAPD2 (R = 0.56 p < 0.05), NCAPD3 and NCAPD2 (R = 0.63 p < 0.05), NCAPG2 and NCACPD2 (R = 0.49 p < 0.05), NCAPH and NCAPG (R = 0.72 p < 0.05), NCAPD3 and NCAPG (R = 0.57 p < 0.05), NCAPG2 and NCAPG (R = 0.65 p < 0.05), NCAPH2 and NCAPG (R = 0.4 p < 0.05), NCAPD3 and NCAPH (R = 0.47 p < 0.05), NCAPG2 and NCAPH (R = 0.49 p < 0.05), NCAPG2 and NCAPD3 (R = 0.64 p < 0.05), NCAPH2 and NCAPG2 (R = 0.32 p < 0.05). But there was no linear correlation between NCAPH2 and NCAPD2, NCAPH2 and NCAPH, NCAPH2 and NCAPH (R < 0.3) (Figure 6A).
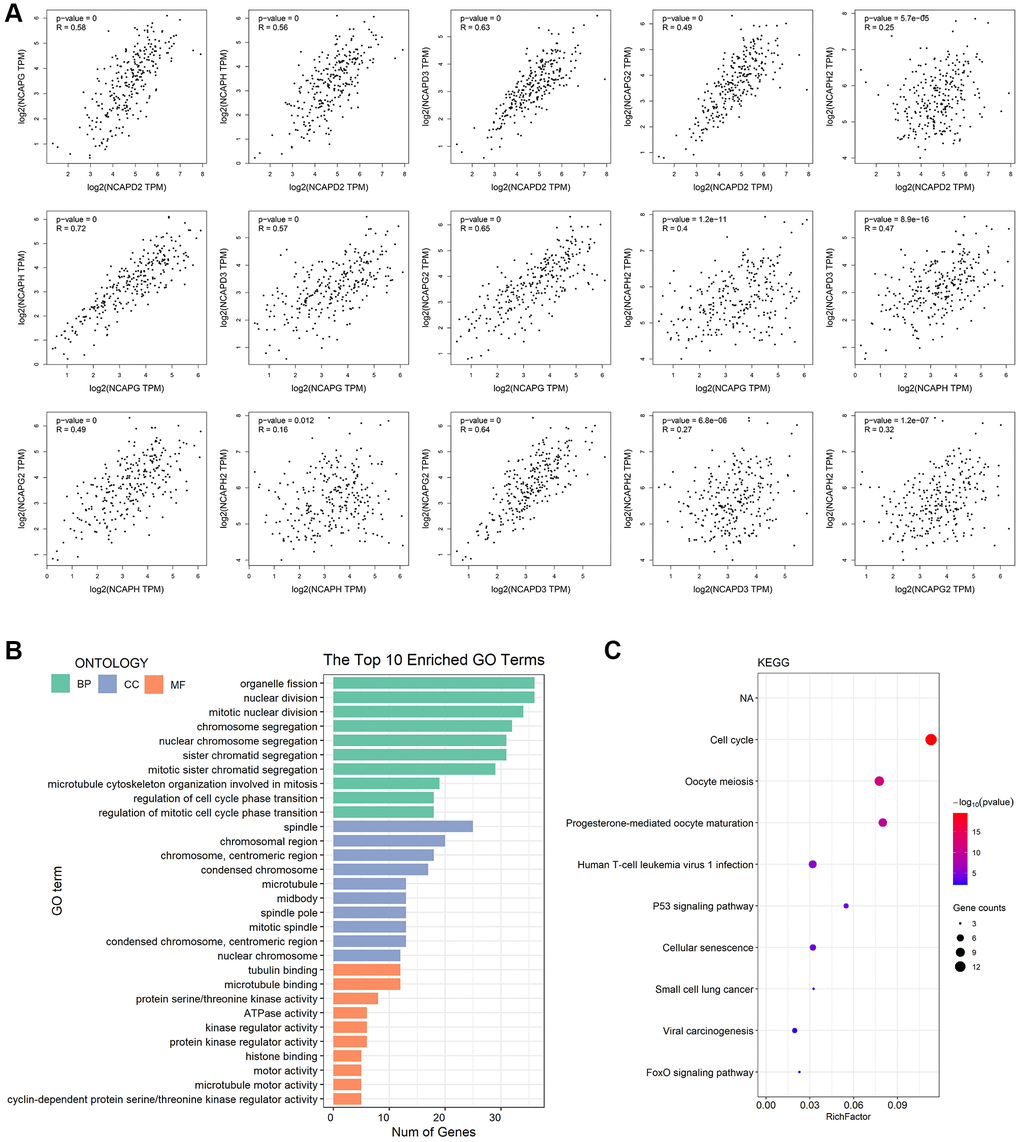
Figure 6. Co-expressed analysis, GO analysis, and functional enrichment analysis of NCAP and their interacting genes. (A) Correlation between NCAP genes in sarcoma. (B) GO analysis was based on three aspects. Abbreviations: BP: biological processes; CC: cellular components; MF: molecular function. (C) KEGG pathway related to NCAP genes and their interacting genes in sarcoma.
Predicted functions and pathways of NCAPs and their 50 interacting genes in sarcoma
We performed GO function enrichment analysis and KEGG pathway analysis of NCAPs and their 50 interacting genes using DAVID database. The results showed that these genes were mainly involved in the biological processes (BPs) of organelle fission, nuclear division and mitotic nuclear division, cellular components (CCs) of spindle, chromosomal region, chromosome centromeric region, and molecular functions (MFs) of tubulin binding, microtubule binding and protein serine/threonine kinase activity (Figure 6B). In addition, KEGG pathway analysis indicated that NCAPs and their 50 interacting genes played a vital role in the cell cycle, oocyte meiosis, and progesterone-mediated oocyte maturation (Figure 6C).
The relationship between the expression level of the NCAPs family and immune cell infiltration
Using the TIMER database, we analyzed the relationship between NCAP gene family and immune cell infiltration (Figure 7). The results showed that high expression of NCAPD2 was significantly associated with low infiltration levels of CD4+ T cells (correlation coefficient (cor) = −0.223, p < 0.05) and macrophages (cor = −0.213, p < 0.05). Similarly, the expression levels of NCAPG (cor = −0.134, p < 0.05), NCAPH (cor = −0.157, p < 0.05), NCAPD 3 (cor = −0.209, p < 0.05), NCAPG 2 (cor = −0.228, p < 0.05), and NCAPH 2 (cor = −0.132, p < 0.05) were significantly negatively correlated with the level of CD4+ T cell infiltration. The expression levels of NCAPD2 (cor = −0.213, p < 0.05), NCAPD3 (cor = −0.209, p < 0.05) and NCAPH2 (cor = −0.195, p < 0.05) were significantly negatively correlated with the macrophage infiltration level.
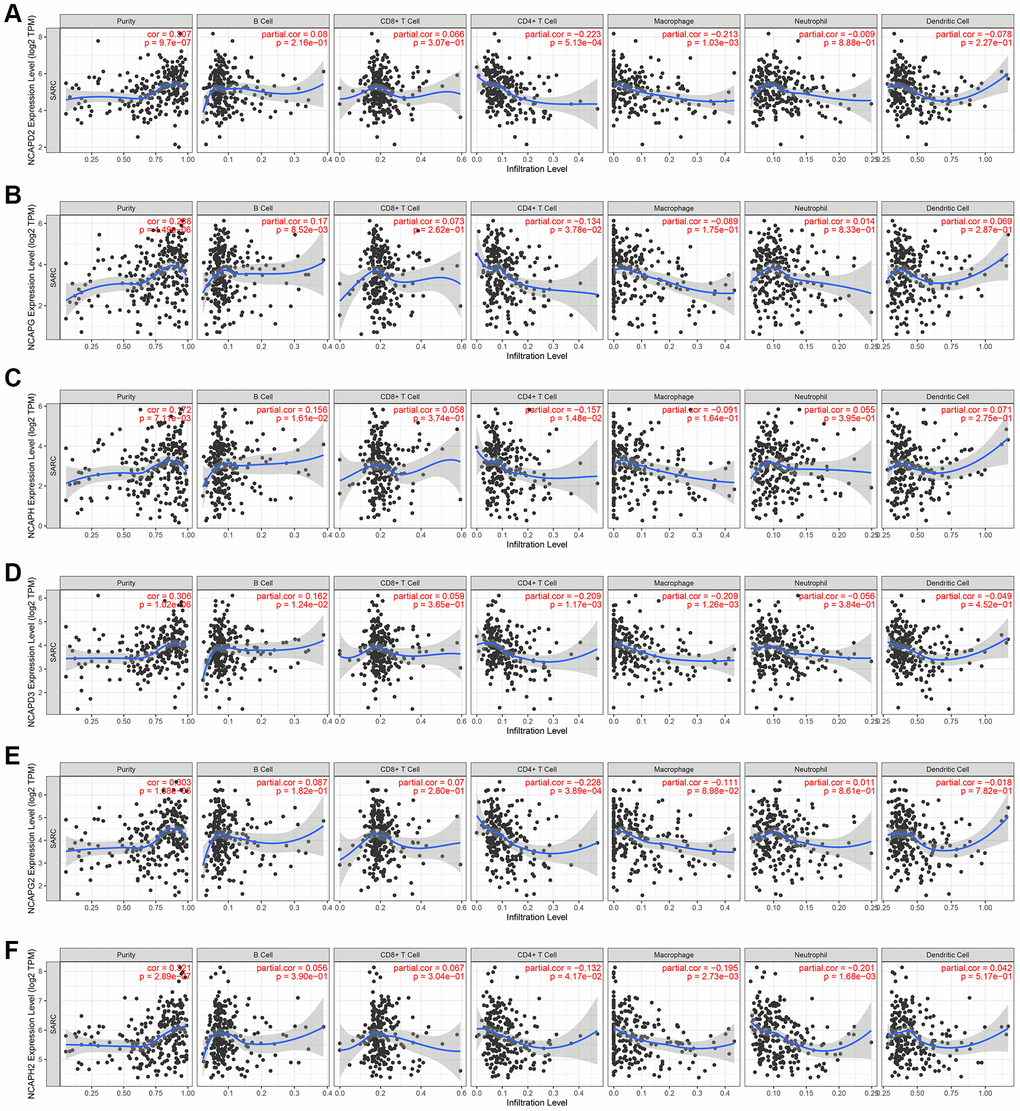
Figure 7. Analysis of immune infiltration. Relationship of differentially expressed (A–F) NCAPD2, NCAPG, NCAPH, NCAPD3, NCAPG2, and NCAPH2 with immune cell infiltration. The immune cells we analyzed included B cells, CD8+ T cells, CD4+ T cells, macrophages, neutrophils, and dendritic cells.
Discussion
Sarcoma is a group of heterogeneous interstitial tumors with more than 100 different diagnostic entities. It is characterized by high malignancy, poor prognosis, and low survival rate. Therefore, it is crucial to find biomarkers for the early prediction of sarcoma. In our study, this is the first time to explore the possibility of using NCAP family genes as biomarkers for sarcoma prognosis.
Bioinformatics analysis is a subject that studies biology by using informatics, applied mathematics, computer science, and statistics [19]. In this study, the expression of NCAP members in sarcoma, signal pathway in sarcoma, immune cell infiltration in sarcoma microenvironment, and its influence on the prognosis of sarcoma patients were studied by bioinformatics analysis. In addition, we explored the correlation between all NCAP family genes. Through the study of the ONCOMINE and GEPIA databases, we found that four members of the NCAP gene family were highly expressed in sarcoma compared with normal human tissue. In addition, the expression of NCAP family genes was explored in this study and we found that NCAP family genes were positively correlated with each other. What’s more, we also confirmed that the high expression of NCAP family members was significantly related to the immune infiltration level of CD4+ T cells and macrophages, which provided a new insight for the effectiveness of future immunotherapy for sarcoma.
Previously, studies have found that NCAPD2 could promote breast cancer progression [20]. NCAPD2 plays a role in colorectal cancer through Ca2+/CAMKK/AMPK/mTORC1 pathway and PARP-1/SIRT1 axis and can be used as a potential therapeutic target [21]. Our research confirmed the value of high expression of NCAPD2 in the prognosis of human sarcoma by using the Kaplan-Meier plotter and GEPIA database, and found that it was negatively correlated with the OS and DFS of sarcoma patients.
Similarly, NCAPH can be used as a prognostic biomarker for non-small cell lung cancer, lung adenocarcinoma, nasopharyngeal carcinoma, breast cancer, and hepatocellular carcinoma [22–26]. In addition, Meng Wang et al. found that NCAPH regulated the occurrence of cervical cancer through the PI3K/AKT/SGK pathway [27]. With Kaplan-Meier Plotter, we verified the prognostic value of NCAPH in sarcoma: the high expression of NCAPH was negatively correlated with OS and RFS, and NCAPH can be used as a promising potential biomarker for sarcoma.
As for NCAPG, it has been proved to be involved in the development of prostate cancer, lung adenocarcinoma, hepatocellular carcinoma, and non-small cell lung cancer [28–31]. However, our research proved that the high expression of NCAPG in sarcoma is relevant to the lower OS and DFS of sarcoma patients.
High expression of NCAPG2 has been shown to be associated with poor prognosis in patients with lung adenocarcinoma and hepatocellular carcinoma [14, 32]. In addition, the research of Jianheng Wu et al. demonstrated that NCAPG2 in glioblastoma promoted cell malignant transformation and activation by phosphorylating HBO1 [33]. In GEPIA dataset, we verified that the overexpression of NCAPG2 was positively correlated with low DFS of sarcoma patients.
Abnormal methylation of NCAPH2 in the blood of patients with subjective cognitive decline may be a biomarker for early screening of Alzheimer’s disease [17], but no related research has mentioned that NCAPH2 was related to cancer prognosis. In our research, we also found that the overexpression of NCAPH2 had statistical significance in correlation with low RFS of sarcoma patients.
What’s more, high expression of NCAPD3 was confirmed to be related to the occurrence and progression of the tumor by Zuolei Jing et al. in chromatic cancer, and overexpression of NCAPD3 led to poor prognosis of chromatic cancer [34]. From our research results, we also found that high expression of NCAPD3 was related to the poor prognosis of sarcoma in the Kaplan-Meier Plotter database.
In addition, we used GO analysis to analyze the biological processes involved in the NCAPs gene family and their interacting genes. The results showed that NCAPs and their interacting genes were mainly involved in the biological processes and molecular functions related to the cell division and were mainly expressed in structures related to cell division. In addition, KEGG analysis also showed that NCAPs gene family and their interacting genes were mainly concentrated in cell cycle-related signaling pathways. These results suggested that the abnormal expression of NCAPs and its interacting genes may be involved in the occurrence and development of tumors by altering the normal cell cycle. The cell cycle is a complex process that involves many regulatory proteins everywhere in organisms [35]. Previously, PJan M Suski et al. showed that abnormal activity of core cell cycle mechanism existed in different types of tumors, so inhibition the expression of different cell cycle proteins can be used as a new strategy for tumor treatment [36].
In our study, we explored the expression of NCAPs in sarcoma, which had important value for the prognosis of sarcoma patients. In other words, the high expression of these genes often leads to a more malignant sarcoma. Therefore, the six members of the NCAP family genes are all expected to become an important biomarker for sarcoma diagnosis and prognosis prediction and the expression level of NCAPs gene family were all related to the infiltration level of immune cells in sarcoma tumor microenvironment. However, our research still had some limitations. First of all, we used all the existing data but needed more experimental verification, including histological analysis and qPCR. Secondly, this study only explored the NCAP family genes in sarcoma tissues but did not study the expression of NCAPs in the blood of sarcoma patients. If we can further research the expression of NCAPs in the peripheral blood of sarcoma patients, it is expected to become a more convenient diagnostic screening method.
Conclusions
In a word, we confirmed the high expression of the NCAPs family in sarcoma by bioinformatics analysis, the high expression of the six members of NCAP gene family were all connected with the prognosis and immune infiltration of sarcoma, and their high expression provided a novel target for the therapy of sarcoma and a new insight for the efficacy of immunotherapy of sarcoma.
Methods
ONCOMINE (http://www.oncomine.org/) analysis
The ONCOMINE database was usually utilized to investigate the NCAP family’s differential expression and clinical relevance in various cancers. The expression information of the NCAP family in sarcoma and the clinical correlation of NCAPs genes were retrieved from ONCOMINE, with default settings of fold change > 2 and P value < 0.05. The ONCOMINE database was discontinued in 2022.
GEPIA (http://gepia.cancer-pku.cn/) analysis
Gene Expression Profiling Interactive Analysis (GEPIA) is a web server based on normal gene and cancer expression profiling and interactive analysis [37]. In this study, GEPIA was extensively applied to investigate the distinct expression and the prognostic value of the NCAP family genes in sarcoma and correlation analysis between NCAP family members, with default setting p < 0.05.
Kaplan-Meier plotter (http://kmplot.com/analysis/) analysis
In this study, the Kaplan-Meier plotter was used to explore the connection between the prognosis of sarcoma patients and different expressions of NCAPs, including relapse free survival and overall survival. Kaplan Meier Plotter contains survival information for 21 diverse types of cancer, containing sarcomas, and expression data for 54,000 genes. In addition, Kaplan-Meier plotter compares NCAPs mRNA high and low expression levels in samples to correlate prognosis with hazard ratios (HR) and log-rank P values with 95% confidence intervals.
KEGG and GO enrichment analyses of NACPs and their interacting genes
Kyoto Encyclopedia of Genes and Genomes (KEGG) pathway and Gene Ontology (GO) Enrichment analysis of NCAP gene family and their interacting genes were performed using the DAVID database. DAVID (Database for Annotation, Visualization and Integrated Discovery) is an online tool and database based on bioinformatics that aims to assist researchers in annotating and analyzing large amounts of gene and protein data. The DAVID database contains a wide range of biological information and functional annotations, including Gene Ontology, biological pathways, disease associations, and more.
TIMER dataset (https://cistrome.shinyapps.io/timer/) analysis
Tumor Immune Estimation Resource (TIMER) database pre-computed the levels of infiltrating immune systems in about six subsets for 10,897 tumors from 32 cancer types and investigated molecular characterization of tumor-immune interactions [38]. So, we took full advantage of the TIMER database to explore the expression of NCAPs in sarcoma and the correlation between the expression level of the NCAPs family and the infiltration level of different immune cells.
Availability of data and materials
All data generated or analysed during this study are included in this published article.
Author Contributions
GW and QT conceived and designed the study, and also critically revised the manuscript. GJ, YL and WW conducted the experiments and drafted the manuscript. PS, ZL, YL, JC, RC, HZ and GW contributed to the revision of the manuscript. All authors have read and approved the final manuscript.
Acknowledgments
We appreciate the contribution made by Qunyan Tian from the Orthopedics Department of the Second Xiangya Hospital of Central South University to this study. All authors have agreed that Qunyan Tian will use the content of this study to write her master’s thesis and participate in the master’s degree defense.
Conflicts of Interest
The authors declare no conflicts of interest related to this study.
Funding
This work was supported by Key research and development Project of the Ministry of Science and Technology in 2022: R&D and Demonstration application of key technologies of cloud-integrated visual-audio-touch multi-mode interactive feedback high simulation intelligent virtual surgery (Grant no. 2022YFF1202600). The study funders/sponsors had no role in the design and conduct of the study; collection, management, analysis, and interpretation of the data; preparation, review, or approval of the manuscript; and decision to submit the manuscript for publication.
References
- 1. Skubitz KM, D'Adamo DR. Sarcoma. Mayo Clin Proc. 2007; 82:1409–32. https://doi.org/10.4065/82.11.1409 [PubMed]
- 2. Popovich JR, Kashyap S, Gasalberti DP, Cassaro S. Sarcoma. In: StatPearls. Treasure Island (FL): StatPearls Publishing; 2023. [PubMed]
- 3. Zhao X, Wu Q, Gong X, Liu J, Ma Y. Osteosarcoma: a review of current and future therapeutic approaches. Biomed Eng Online. 2021; 20:24. https://doi.org/10.1186/s12938-021-00860-0 [PubMed]
- 4. Mattiuzzi C, Lippi G. Current Cancer Epidemiology. J Epidemiol Glob Health. 2019; 9:217–22. https://doi.org/10.2991/jegh.k.191008.001 [PubMed]
- 5. Broadhead ML, Clark JC, Myers DE, Dass CR, Choong PF. The molecular pathogenesis of osteosarcoma: a review. Sarcoma. 2011; 2011:959248. https://doi.org/10.1155/2011/959248 [PubMed]
- 6. Bishop MW, Janeway KA, Gorlick R. Future directions in the treatment of osteosarcoma. Curr Opin Pediatr. 2016; 28:26–33. https://doi.org/10.1097/MOP.0000000000000298 [PubMed]
- 7. Smrke A, Anderson PM, Gulia A, Gennatas S, Huang PH, Jones RL. Future Directions in the Treatment of Osteosarcoma. Cells. 2021; 10:172. https://doi.org/10.3390/cells10010172 [PubMed]
- 8. Blay JY. Intensity of recent years in the investigation of soft tissue sarcoma. Future Oncol. 2017; 13:3–9. https://doi.org/10.2217/fon-2017-0119 [PubMed]
- 9. Hirano T. Condensins: universal organizers of chromosomes with diverse functions. Genes Dev. 2012; 26:1659–78. https://doi.org/10.1101/gad.194746.112 [PubMed]
- 10. Hirano T, Kobayashi R, Hirano M. Condensins, chromosome condensation protein complexes containing XCAP-C, XCAP-E and a Xenopus homolog of the Drosophila Barren protein. Cell. 1997; 89:511–21. https://doi.org/10.1016/s0092-8674(00)80233-0 [PubMed]
- 11. Kimura K, Cuvier O, Hirano T. Chromosome condensation by a human condensin complex in Xenopus egg extracts. J Biol Chem. 2001; 276:5417–20. https://doi.org/10.1074/jbc.C000873200 [PubMed]
- 12. Seipold S, Priller FC, Goldsmith P, Harris WA, Baier H, Abdelilah-Seyfried S. Non-SMC condensin I complex proteins control chromosome segregation and survival of proliferating cells in the zebrafish neural retina. BMC Dev Biol. 2009; 9:40. https://doi.org/10.1186/1471-213X-9-40 [PubMed]
- 13. Schleiffer A, Kaitna S, Maurer-Stroh S, Glotzer M, Nasmyth K, Eisenhaber F. Kleisins: a superfamily of bacterial and eukaryotic SMC protein partners. Mol Cell. 2003; 11:571–5. https://doi.org/10.1016/s1097-2765(03)00108-4 [PubMed]
- 14. Ono T, Losada A, Hirano M, Myers MP, Neuwald AF, Hirano T. Differential contributions of condensin I and condensin II to mitotic chromosome architecture in vertebrate cells. Cell. 2003; 115:109–21. https://doi.org/10.1016/s0092-8674(03)00724-4 [PubMed]
- 15. Dowen JM, Bilodeau S, Orlando DA, Hübner MR, Abraham BJ, Spector DL, Young RA. Multiple structural maintenance of chromosome complexes at transcriptional regulatory elements. Stem Cell Reports. 2013; 1:371–8. https://doi.org/10.1016/j.stemcr.2013.09.002 [PubMed]
- 16. Liu W, Tanasa B, Tyurina OV, Zhou TY, Gassmann R, Liu WT, Ohgi KA, Benner C, Garcia-Bassets I, Aggarwal AK, Desai A, Dorrestein PC, Glass CK, Rosenfeld MG. PHF8 mediates histone H4 lysine 20 demethylation events involved in cell cycle progression. Nature. 2010; 466:508–12. https://doi.org/10.1038/nature09272 [PubMed]
- 17. Martin CA, Murray JE, Carroll P, Leitch A, Mackenzie KJ, Halachev M, Fetit AE, Keith C, Bicknell LS, Fluteau A, Gautier P, Hall EA, Joss S, et al, and Deciphering Developmental Disorders Study. Mutations in genes encoding condensin complex proteins cause microcephaly through decatenation failure at mitosis. Genes Dev. 2016; 30:2158–72. https://doi.org/10.1101/gad.286351.116 [PubMed]
- 18. Zhao R, Xiong C, Zhang C, Wang L, Liang H, Luo X. Construction of a Prognosis-Related Gene Signature by Weighted Gene Coexpression Network Analysis in Ewing Sarcoma. Comput Math Methods Med. 2022; 2022:8798624. https://doi.org/10.1155/2022/8798624 [PubMed]
- 19. Pallen MJ. Microbial bioinformatics 2020. Microb Biotechnol. 2016; 9:681–6. https://doi.org/10.1111/1751-7915.12389 [PubMed]
- 20. He J, Gao R, Yang J, Li F, Fu Y, Cui J, Liu X, Huang K, Guo Q, Zhou Z, Wei W. NCAPD2 promotes breast cancer progression through E2F1 transcriptional regulation of CDK1. Cancer Sci. 2023; 114:896–907. https://doi.org/10.1111/cas.15347 [PubMed]
- 21. Jing Z, He X, Jia Z, Sa Y, Yang B, Liu P. NCAPD2 inhibits autophagy by regulating Ca2+/CAMKK2/AMPK/mTORC1 pathway and PARP-1/SIRT1 axis to promote colorectal cancer. Cancer Lett. 2021; 520:26–37. https://doi.org/10.1016/j.canlet.2021.06.029 [PubMed]
- 22. Zhou W, Hu J, Zhao J. Non-SMC condensin I complex subunit H (NCAPH), a regulator of cell cycle, predicts poor prognosis in lung adenocarcinoma patients: a study mainly based on TCGA and GEO database. Transl Cancer Res. 2020; 9:7572–87. https://doi.org/10.21037/tcr-20-2217 [PubMed]
- 23. Xiong Q, Fan S, Duan L, Liu B, Jiang X, Chen X, Xiong C, Tao Q, Wang J, Zhang H, Chen C, Duan Y. NCAPH is negatively associated with Mcl-1 in non-small cell lung cancer. Mol Med Rep. 2020; 22:2916–24. https://doi.org/10.3892/mmr.2020.11359 [PubMed]
- 24. Xu L, Jiang Y, Zheng J, Xie G, Li J, Shi L, Fan S. Aberrant expression of β-catenin and E-cadherin is correlated with poor prognosis of nasopharyngeal cancer. Hum Pathol. 2013; 44:1357–64. https://doi.org/10.1016/j.humpath.2012.10.025 [PubMed]
- 25. Cui F, Hu J, Xu Z, Tan J, Tang H. Overexpression of NCAPH is upregulated and predicts a poor prognosis in prostate cancer. Oncol Lett. 2019; 17:5768–76. https://doi.org/10.3892/ol.2019.10260 [PubMed]
- 26. Lu H, Shi C, Wang S, Yang C, Wan X, Luo Y, Tian L, Li L. Identification of NCAPH as a biomarker for prognosis of breast cancer. Mol Biol Rep. 2020; 47:7831–42. https://doi.org/10.1007/s11033-020-05859-9 [PubMed]
- 27. Wang M, Qiao X, Cooper T, Pan W, Liu L, Hayball J, Lin J, Cui X, Zhou Y, Zhang S, Zou Y, Zhang R, Wang X. HPV E7-mediated NCAPH ectopic expression regulates the carcinogenesis of cervical carcinoma via PI3K/AKT/SGK pathway. Cell Death Dis. 2020; 11:1049. https://doi.org/10.1038/s41419-020-03244-9 [PubMed]
- 28. Liu W, Liang B, Liu H, Huang Y, Yin X, Zhou F, Yu X, Feng Q, Li E, Zou Z, Wu L. Overexpression of non-SMC condensin I complex subunit G serves as a promising prognostic marker and therapeutic target for hepatocellular carcinoma. Int J Mol Med. 2017; 40:731–8. https://doi.org/10.3892/ijmm.2017.3079 [PubMed]
- 29. Gong C, Ai J, Fan Y, Gao J, Liu W, Feng Q, Liao W, Wu L. NCAPG Promotes The Proliferation Of Hepatocellular Carcinoma Through PI3K/AKT Signaling. Onco Targets Ther. 2019; 12:8537–52. https://doi.org/10.2147/OTT.S217916 [PubMed]
- 30. Wu Y, Lin Y, Pan J, Tu X, Xu Y, Li H, Chen Y. NCAPG promotes the progression of lung adenocarcinoma via the TGF-β signaling pathway. Cancer Cell Int. 2021; 21:443. https://doi.org/10.1186/s12935-021-02138-w [PubMed]
- 31. Sun H, Zhang H, Yan Y, Li Y, Che G, Zhou C, Nicot C, Ma H. NCAPG promotes the oncogenesis and progression of non-small cell lung cancer cells through upregulating LGALS1 expression. Mol Cancer. 2022; 21:55. https://doi.org/10.1186/s12943-022-01533-9 [PubMed]
- 32. Leiserson MD, Vandin F, Wu HT, Dobson JR, Eldridge JV, Thomas JL, Papoutsaki A, Kim Y, Niu B, McLellan M, Lawrence MS, Gonzalez-Perez A, Tamborero D, et al. Pan-cancer network analysis identifies combinations of rare somatic mutations across pathways and protein complexes. Nat Genet. 2015; 47:106–14. https://doi.org/10.1038/ng.3168 [PubMed]
- 33. Wu J, Li L, Jiang G, Zhan H, Zhu X, Yang W. NCAPG2 facilitates glioblastoma cells' malignancy and xenograft tumor growth via HBO1 activation by phosphorylation. Cell Tissue Res. 2021; 383:693–706. https://doi.org/10.1007/s00441-020-03281-y [PubMed]
- 34. Jing Z, Liu Q, Xie W, Wei Y, Liu J, Zhang Y, Zuo W, Lu S, Zhu Q, Liu P. NCAPD3 promotes prostate cancer progression by up-regulating EZH2 and MALAT1 through STAT3 and E2F1. Cell Signal. 2022; 92:110265. https://doi.org/10.1016/j.cellsig.2022.110265 [PubMed]
- 35. Schafer KA. The cell cycle: a review. Vet Pathol. 1998; 35:461–78. https://doi.org/10.1177/030098589803500601 [PubMed]
- 36. Suski JM, Braun M, Strmiska V, Sicinski P. Targeting cell-cycle machinery in cancer. Cancer Cell. 2021; 39:759–78. https://doi.org/10.1016/j.ccell.2021.03.010 [PubMed]
- 37. Tang Z, Li C, Kang B, Gao G, Li C, Zhang Z. GEPIA: a web server for cancer and normal gene expression profiling and interactive analyses. Nucleic Acids Res. 2017; 45:W98–102. https://doi.org/10.1093/nar/gkx247 [PubMed]
- 38. Li T, Fu J, Zeng Z, Cohen D, Li J, Chen Q, Li B, Liu XS. TIMER2.0 for analysis of tumor-infiltrating immune cells. Nucleic Acids Res. 2020; 48:W509–14. https://doi.org/10.1093/nar/gkaa407 [PubMed]