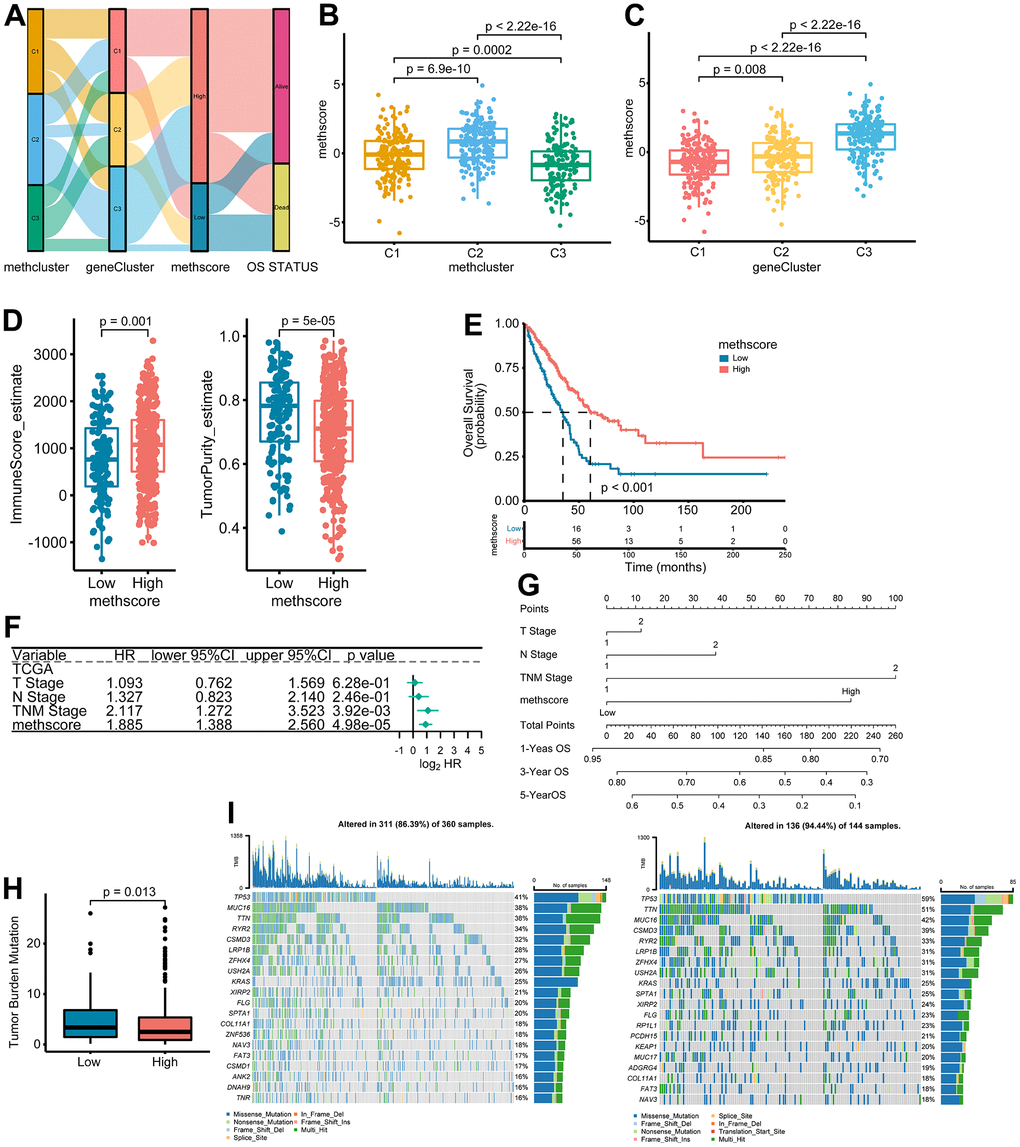
Figure 6.The association between MethScore with clinical, immunological, and genomic features. (A) Sankey diagram showing the links between MRG cluster, MRG-gene cluster, MethScore, and survival status. (B, C) Distribution of MethScore in the different MRG clusters (B) and gene clusters (C). (D) Box plots showing the difference of immune score and tumor purity in groups with high or low MethScore. The TME score was evaluated using the ESTIMATE algorithm. (E) Kaplan-Meier curves for high and low MethScore patient groups in TCGA LUAD cohort. (F) Multivariate analysis of MethScore for OS in the TCGA LUAD cohort. Only variables with p ≤ 0.20 in the univariate analysis were retained. Please see Supplementary Table 5 for the full list of variables. (G) Nomogram for predicting 1-, 3-, and 5-year OS for LUAD patients in TCGA cohort. (H) Relative distribution of tumor mutation burden (TMB) in patients with high and low MethScore. (I) The difference in mutational profiles in TCGA LUAD stratified by high (left panel) versus low MethScore (right panel) subgroups. The top 20 frequently mutated genes were shown.