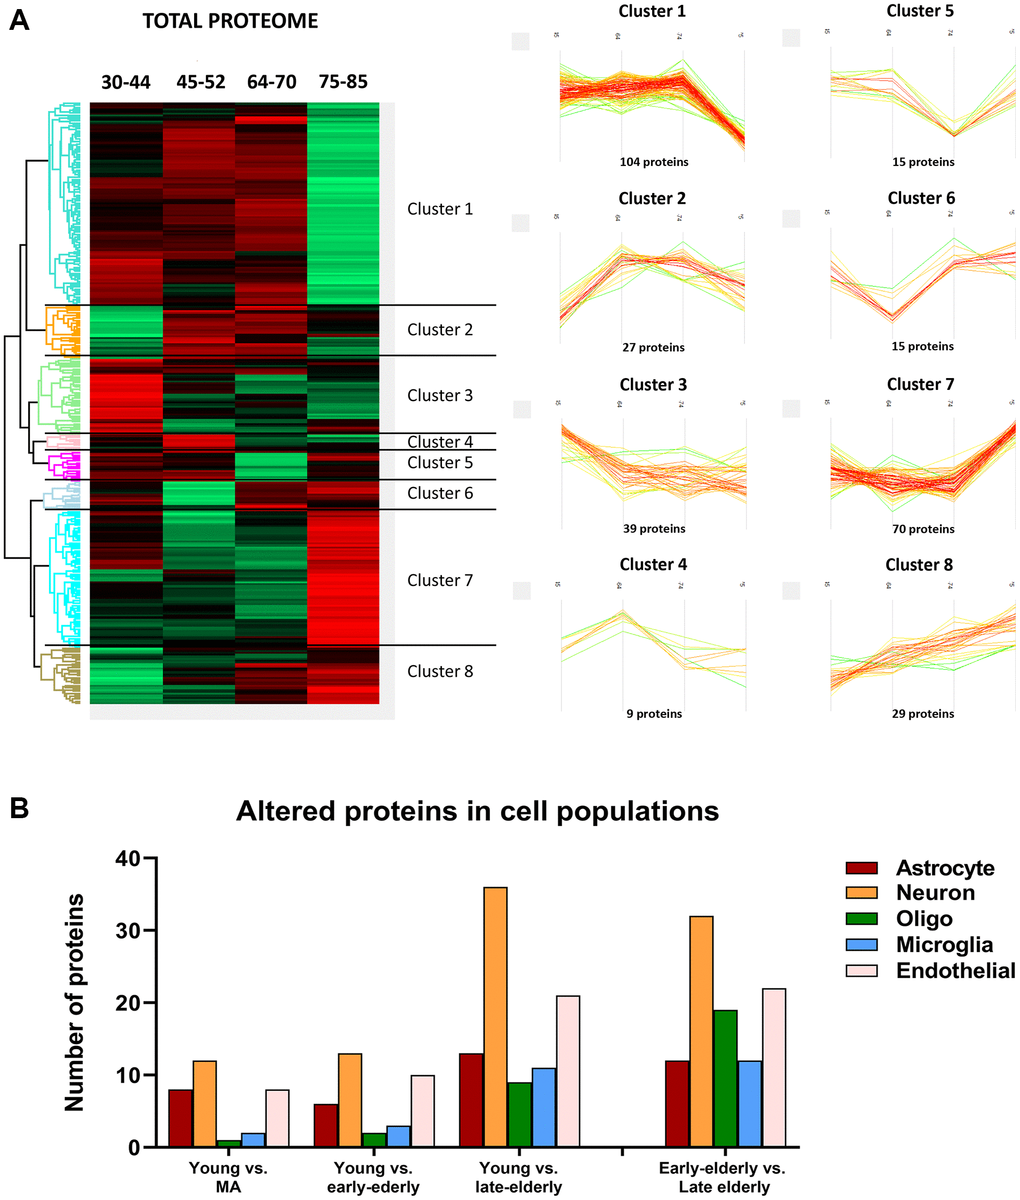
Figure 3.(A) Differentially expressed proteins across age. (Left) Heatmap representing the differential expressed proteins across the four age groups: group 1 (young): 30–44y; group 2 (middle-aged: MA): 45–52y; group 3 (early-elderly): 64–70y; and group 4 (late-elderly): 75–85y. Each line corresponds to a protein, in which the Z-score is represented as a numerical measurement that describes the relationship between averaged protein intensity values in a specific condition and the mean intensity for each protein across all experimental conditions. The Z-score (considered a measurement in terms of standard deviations from the mean) may be positive (scoring above the mean; represented in red) or negative (scoring below the mean; represented in green). (Right) Profile-plots representing protein clusters with similar expression trajectories across age. The most representative clusters show protein groups specifically down-regulated (Cluster 1) or up-regulated (Cluster 7) in the late-elderly group. (B) The graphical representation illustrates the cellular type assignment of proteins based on available RNA-seq databases. The major changes are observed in proteins associated with neurons.