


Introduction
Brain aging is a progressive detrimental process manifested by specific structural, molecular, and functional changes with a variable individual pace. Brain aging is complex because it affects different neuronal types, connections, astroglia, microglia and oligodendroglia, blood vessels, and other intrinsic and systemic cell populations. Moreover, aging does not work according to simple cause-effect logic. Outcomes are not directly caused by a single driver but emerge from multiple, non-related, and combined events following non-cartesian, non-linear logic. Alterations of nucleotides, nucleic acids, proteins, lipids, carbohydrates, and metabolites occur at individual cellular levels. Such alterations are part of the molecular substrates which result in impaired brain function in the aged brain and human elderly. Human brain aging is also linked with numerous neurodegenerative diseases such as dementia of Alzheimer’s [1, 2].
The present study is focused on protein changes in the aged human frontal cortex. Previous whole proteomics studies have identified modifications in the expression levels of proteins during human brain aging [3–18]. Relevant conclusions can be summarized along these lines: (i) there is progressive deregulation of protein expression in the elderly; (ii) there are marked individual variations; (iii) there are regional differences within the same age range; and (iv) multiple structures and metabolic pathways are targeted by altered protein expression levels.
Most studies in humans are performed using brain samples with age-dependent progressive accumulation of Alzheimer’s disease-related pathology (or AD neuropathological changes: ADNC), named neurofibrillary tangles (NFTs) and senile plaques (SPs). This situation is not strange as about 85% of the human population has NFTs at least in the deep temporal cortex (corresponding to stages I, II or IIII) without cognitive impairment at 65; about 98% have more extensive NFT pathology and 30% dementia at 80. About 30% has SPs at the age of 65, whereas SPs are found in around 60% of individuals over 80 [1, 19–25]. As a result, most if not all studies of the proteome in human brain aging are carried out in samples of individuals having variable degree of ADNC. Those without cognitive impairment labelled as normal for age (but usually having NFT pathology at Braak stages I–III) were compared with individuals with mild cognitive impairment or dementia of Alzheimer’s type having large numbers of NFTs and SPs.
Phosphorylation is one of the most common and essential mechanisms of protein regulation throughout activation or inhibition of protein function and interaction of recruited proteins [26–31]. Several studies have identified deregulated protein phosphorylation in sAD [10, 32–39], even at first stages (stages I-II) of NFT pathology in the frontal cortex in which no NFTs and SPs are present at these stages [38]. Differentially regulated phosphoproteins are components of cell membranes and membrane signaling, cytoskeleton, synapses including neurotransmitter receptors, serine-threonine kinases, proteins involved in energy metabolism, and RNA processing and splicing. Deregulated protein phosphorylation is more pronounced at stages III and IV; it is maintained at advanced stages of AD [38]. Altered brain protein phosphorylation also occurs in human tauopathies [40, 41]; it has also been described in transgenic mouse models of cerebral β-amyloidosis, and tauopathy [42–47]. To our knowledge, whole phosphoproteomes centered on the human brain aging without AD pathology are unavailable.
The purpose of the present study was to obtain proteomics and phosphoprotemics data of the frontal cortex (FC) at different age stages, from 30 to 85 years, in individuals without NFTs and SPs pathology in any brain region of the telencephalon. In addition, these subjects had not concomitant age-related pathologies such as TDP-43 proteinopathy (LATE), α-synucleinopathy, other tauopathies such as argyrophilic grain disease, frontotemporal lobar degeneration (FTLD), hippocampal sclerosis, and vascular diseases. Conventional label-free- and SWATH-MS (Sequential window acquisition of all theoretical fragment ion spectra mass spectrometry) were used to assess the (phospho)proteomes across age groups in the FC. A subgroup of proteins was validated using immunohistochemistry and or western blotting. The limited number of samples (n = 4) in every group is due to the extreme rarity of finding elderly persons without ADNC and any other neuropathological lesion.
Results
To quantify age-dependent fluctuations in the frontal cortex (FC) on a proteome-wide scale, we performed an integrative analysis of the proteome and phosphoproteome across age stages classified by age (years) in four groups: group 1 (young): 30–44, group 2 (middle-aged: MA): 45–52, group 3 (early-elderly): 64–70, and group 4 (late-elderly): 75–85. Although the first group was composed of men only, the distribution of sexes was similar in the other groups. As shown in principal component and dendrogram analyses, the quantified proteomes and phosphoproteomes are not biased in any group, suggesting that there is not a clear effect of the sex variable (Supplementary Figure 1).
Proteome and phosphoproteome dynamics in the FC: functional enrichment analysis
Heatmaps of proteomes and phosphoproteomes showed marked differences in the FC across age groups. A total of 2,830 proteins and 6,722 phosphopeptides were quantified. 308 differential expressed proteins and 465 differential phosphopeptides (306 proteins) were identified when comparing all age groups using the ANOVA one-way test (p < 0.05; Fold Change > 30%) (Figure 1). Two hundred eighty differentially expressed proteins and 278 phosphopeptides were familiar to the four groups (p < 0.05). Protein levels and the direction of hyper- or hypo-phosphorylation were variable in every age group. Some phosphoproteins showed more than one phosphorylation site; the direction of phosphorylation varied in every phosphosite. Only 28 deregulated phosphoproteins also showed altered total expression levels. These numbers indicate that only a tiny percentage of deregulated phosphoproteins might correspond to abnormal expression levels of the corresponding protein.
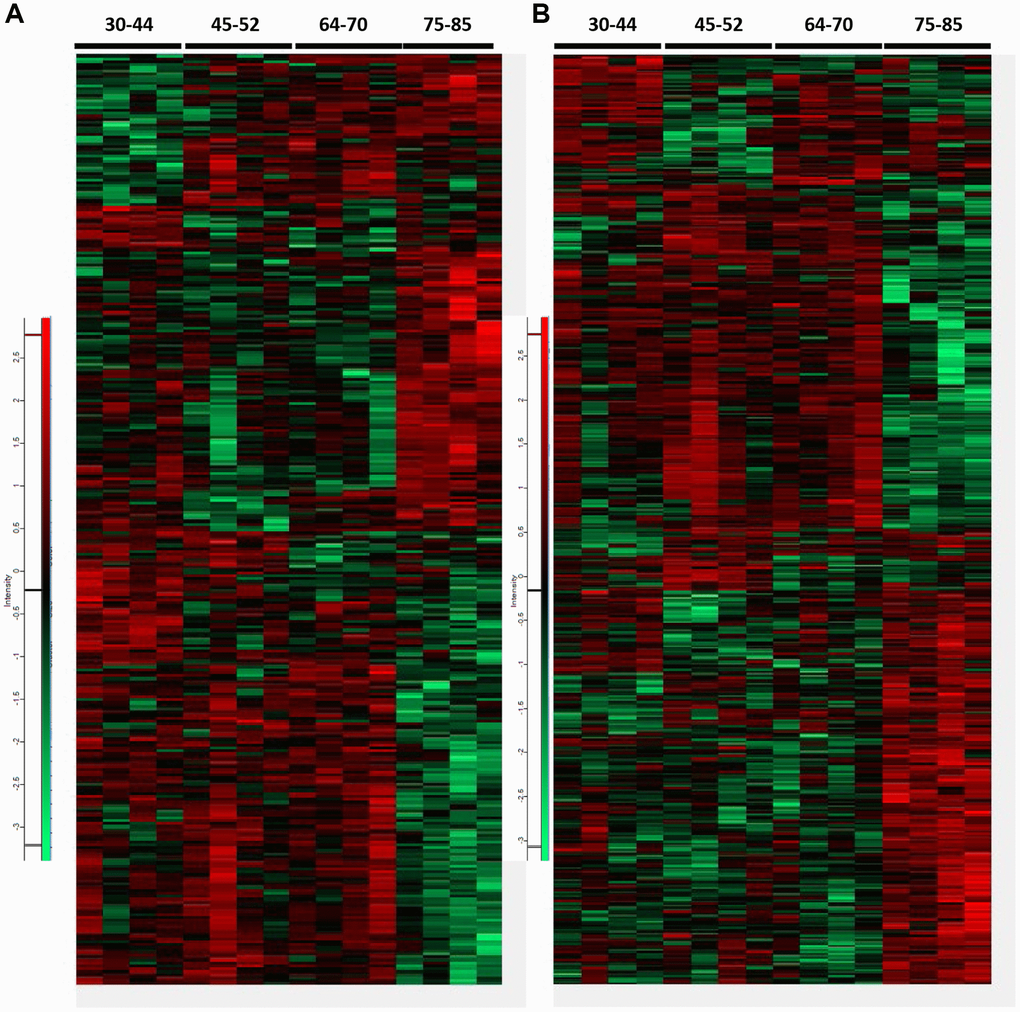
Figure 1. Heatmaps representing differential proteins and phosphopeptides at proteome (A) and phosphoproteome (B), respectively, across all age groups. A total of 308 differentially expressed proteins and 465 differential phosphopeptides were identified when comparing all groups (ANOVA significant, p < 0.05). Among them, 280 proteins and 278 phosphopeptides were common to all groups in proteome and phosphoproteome analysis (p < 0.05). Only 28 proteins with altered expression levels also showed deregulated phosphorylation. Increased levels are indicated in the red spectrum, whereas decreased levels in the green spectrum.
The proteostatic modulation across age stages was assessed by merging and functionally analyzing differential proteomic and phosphoproteomic datasets according to specific biological functions. We evaluated age-related functional alterations using group 1 (young) as a control group. Protein alterations overlapped across age stages and were accompanied by a considerable overlap in enriched GO terms. Main altered terms/functions were associated with membrane trafficking, microtubule cytoskeleton organization, axon guidance, and GTPase alterations related to vesicles and endomembrane processes (Figure 2A).
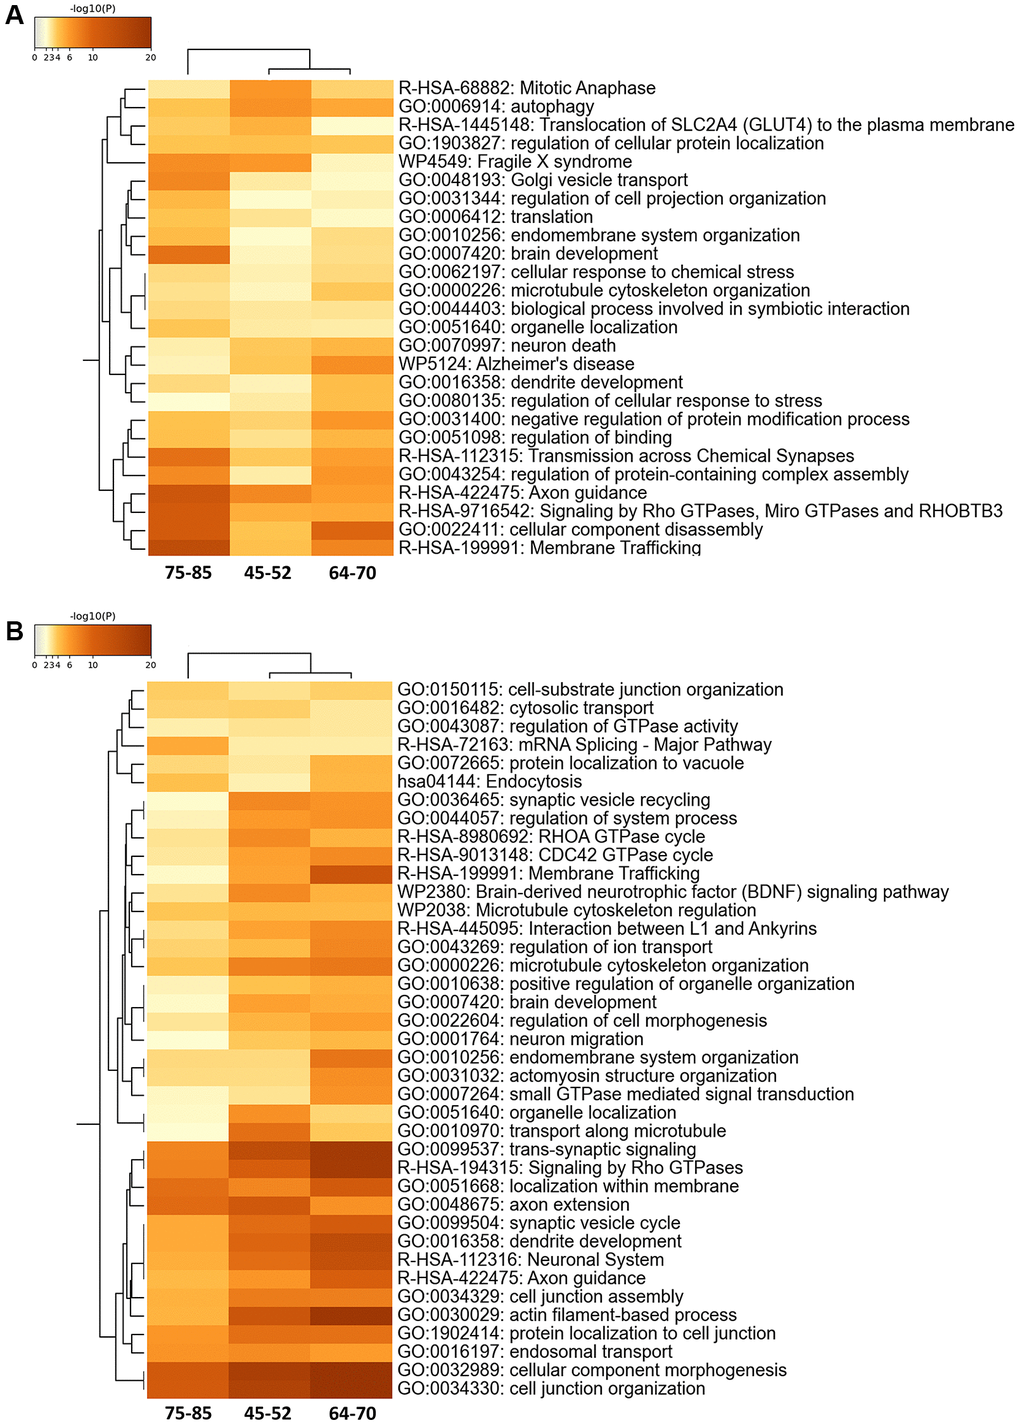
Figure 2. Enriched ontology clusters in the 30% FC differential proteomes (A) and phosphoproteomes (B) during aging using Metascape. After identification of all statistically enriched terms, cumulative hypergeometric p-values and enrichment factors were calculated and used for filtering. The remaining significant terms were then hierarchically clustered into a tree based on Kappa-statistical similarities among their gene memberships. Then, a 0.3 kappa score was applied as the threshold to cast the tree into term clusters. The term with the best p-value within each cluster was selected as its representative term and displayed in a dendrogram.
Phosphoprotein alterations also overlapped across age stages and were accompanied by a considerable overlap in enriched GO terms. Yet, the phosphoproteome showed more functional alterations associated with GO terms than the proteome. Alterations also included those linked to cytostructural functions such as cell-substrate junction organization, interaction between L1 and ankyrins, microtubule cytoskeleton regulation, cell morphogenesis, actomyosin structure organization, axon extension, dendrite development, cell junction assembly, actin filament-based processes, protein localization to cell junction, and cell junction organization (Figure 2B).
Then, deregulated proteins and phosphoproteins were categorized into eight clusters based on their age-dependent expression similarity. Interestingly, protein and phosphoprotein levels of the larger hierarchical clusters were stable until the age of 70 years. After this age, the late-elderly group showed decreased or increased expression of the two major protein clusters, 1 and 7, respectively (Figure 3A). Similarly, major phosphorylation modifications occurred in the late-elderly group in clusters 4 and 8 (Figure 4A). Proteins and phosphoproteins composing every cluster are detailed in the Supplementary Table 1.
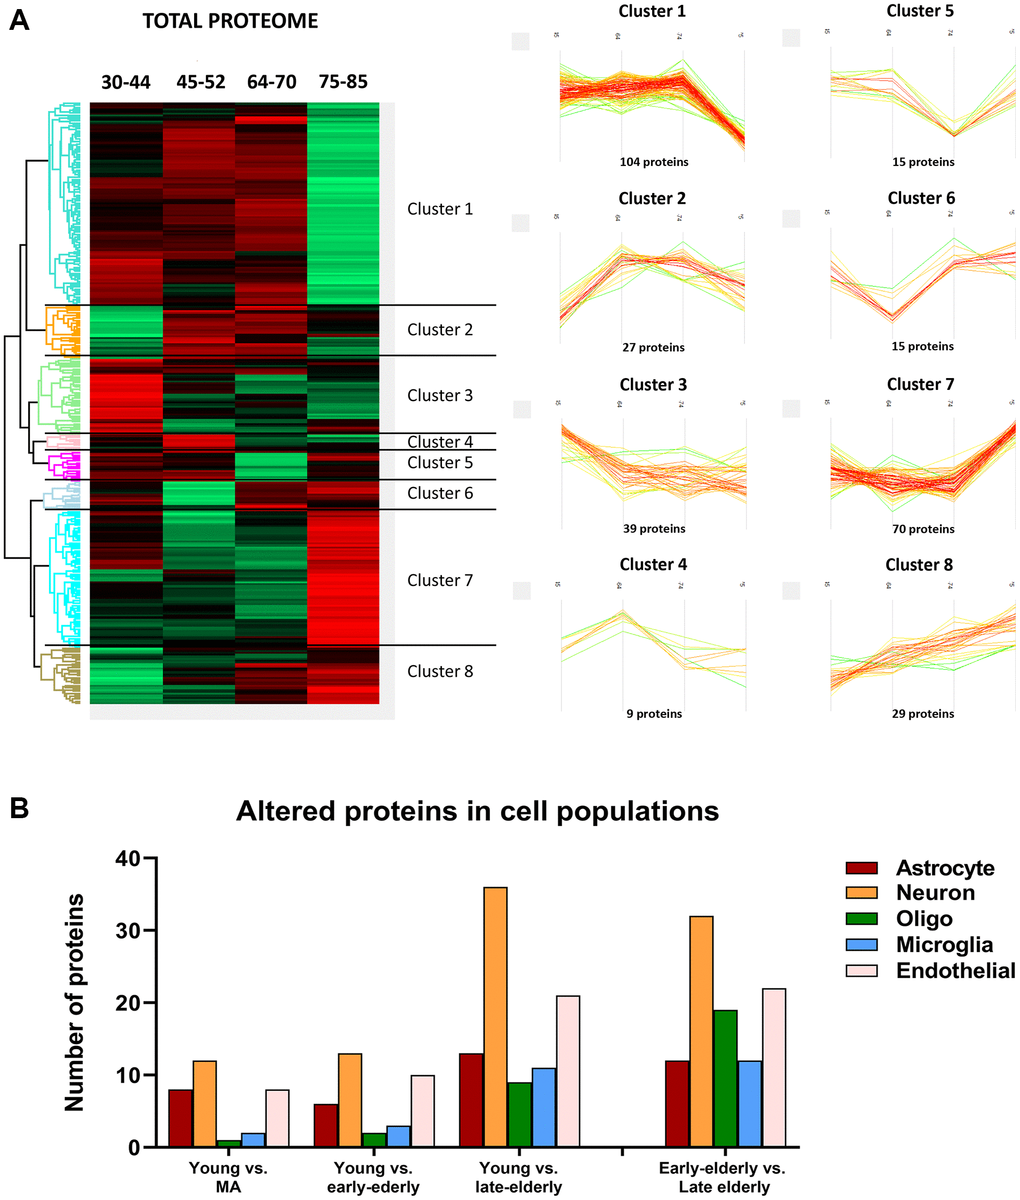
Figure 3. (A) Differentially expressed proteins across age. (Left) Heatmap representing the differential expressed proteins across the four age groups: group 1 (young): 30–44y; group 2 (middle-aged: MA): 45–52y; group 3 (early-elderly): 64–70y; and group 4 (late-elderly): 75–85y. Each line corresponds to a protein, in which the Z-score is represented as a numerical measurement that describes the relationship between averaged protein intensity values in a specific condition and the mean intensity for each protein across all experimental conditions. The Z-score (considered a measurement in terms of standard deviations from the mean) may be positive (scoring above the mean; represented in red) or negative (scoring below the mean; represented in green). (Right) Profile-plots representing protein clusters with similar expression trajectories across age. The most representative clusters show protein groups specifically down-regulated (Cluster 1) or up-regulated (Cluster 7) in the late-elderly group. (B) The graphical representation illustrates the cellular type assignment of proteins based on available RNA-seq databases. The major changes are observed in proteins associated with neurons.
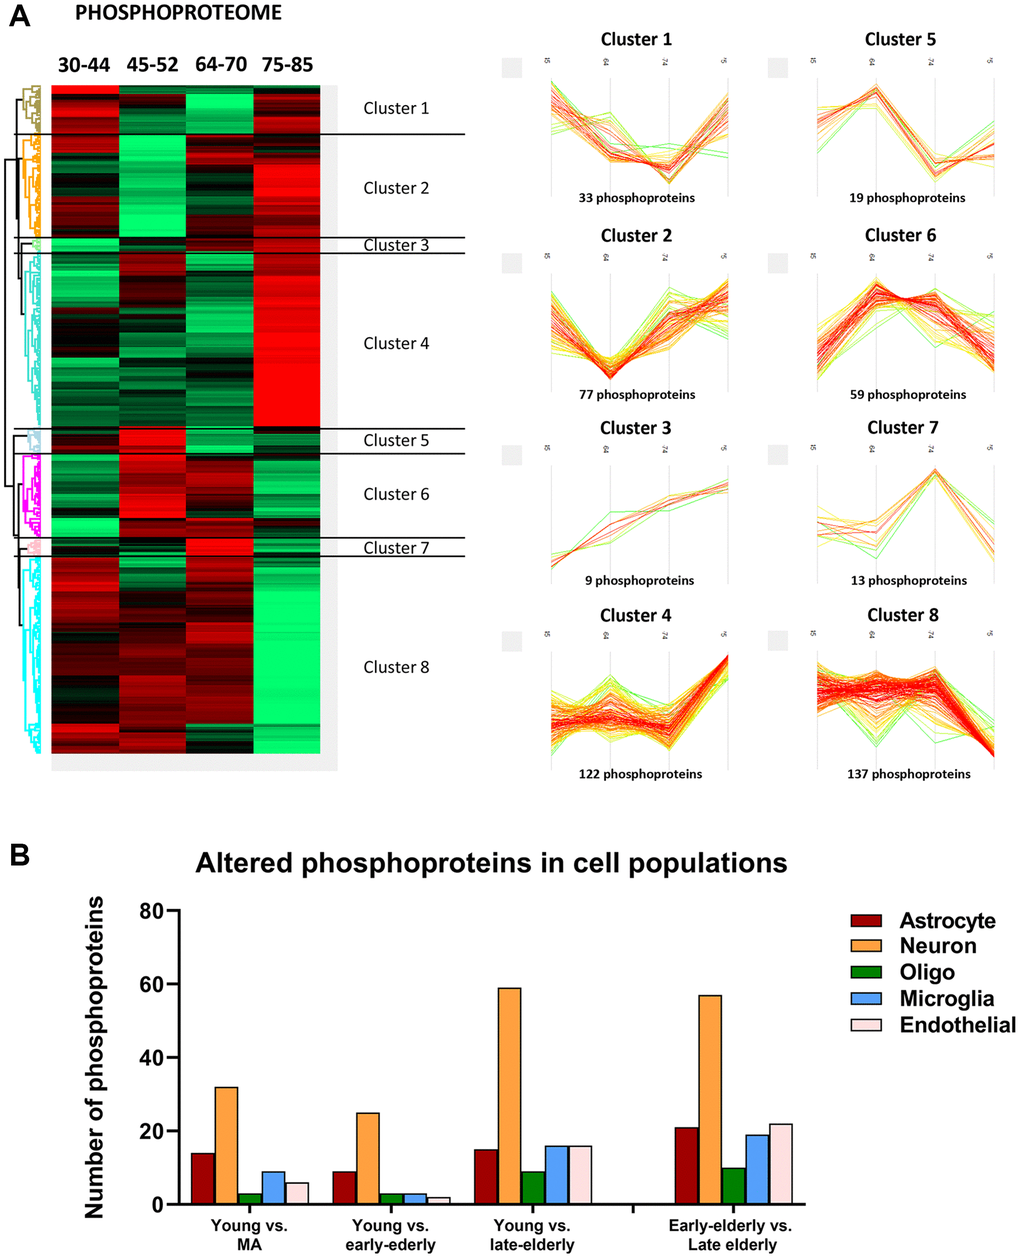
Figure 4. (A) Monitoring of differentially expressed phosphoproteins across age. (Left) Heatmap representing the differential expressed phosphorylated proteins across the four age groups: group 1 (young): 30–44y; group 2 (middle-aged: MA): 45–52y; group 3 (early-elderly): 64–70y; and group 4 (late-elderly): 75–85y. As indicated in Figure 2, each line corresponds to a phosphoprotein in which the Z-score (a measurement in terms of standard deviations from the mean) is evaluated. Positive and negative Z-scoring is represented in red and green respectively. (Right) Profile-plots representing phosphoprotein clusters with similar expression trajectories across age. Cluster 4 and cluster 8 indicate protein subsets that are specifically modulated in the late-elderly group. (B) The graphical representation illustrates the cellular type assignment of phosphoproteins based on available RNA-seq databases. The major changes are observed in proteins associated with neurons.
Additionally, to learn about cell-type-specific molecular signatures, we conducted a multi-comparative analysis comparing our protein data with available cell-type databases of RNA-seq. This procedure allowed the categorization of altered (phospho)proteins as neuronal, astroglial, oligodendroglial, microglial, and endothelial. The main proteomic alterations were related to neuronal populations in all groups. However, these changes were more pronounced with age (Figure 3B). A similar pattern was observed regarding phosphoproteomics data: the higher number of altered phosphoproteins was related to neuronal populations, and major changes were seen in groups 3 and 4 compared with group 1 (Figure 4B).
As observed in Figures 3 and 4, the increase or decrease in protein levels and protein phosphorylation depends on the age-stage in each case, exhibiting a mixture of patterns. However, a significant number of proteins show a consistent pattern that changed in the late-elderly group. These patterns encompass over 50% of the proteins and phosphoproteins. Functional analysis was performed on 174 of 308 proteins and 259 of 469 phosphoproteins that increased or decreased in the late-elderly group. No attempt was made to differentiate between increased or decreased protein expression levels, and between hypo- and hyperphosphorylation because the functional implications of hyper-and hypo-phosphorylation at specific sites are not known for the majority of phosphoproteins. Yet, molecular functions of GO-enrichment analysis revealed that the main altered proteins in clusters 1 and 7 in group 4 were linked to cell membranes functions, vesicle and synaptic functions, RNA binding, and structural components (Figure 5A). GO-molecular functions of deregulated phosphoproteins in clusters 4 and 8 in the group 4 were mainly connected with the cytoskeleton composition and regulation, kinase regulation and membrane stabilization (Figure 5B).
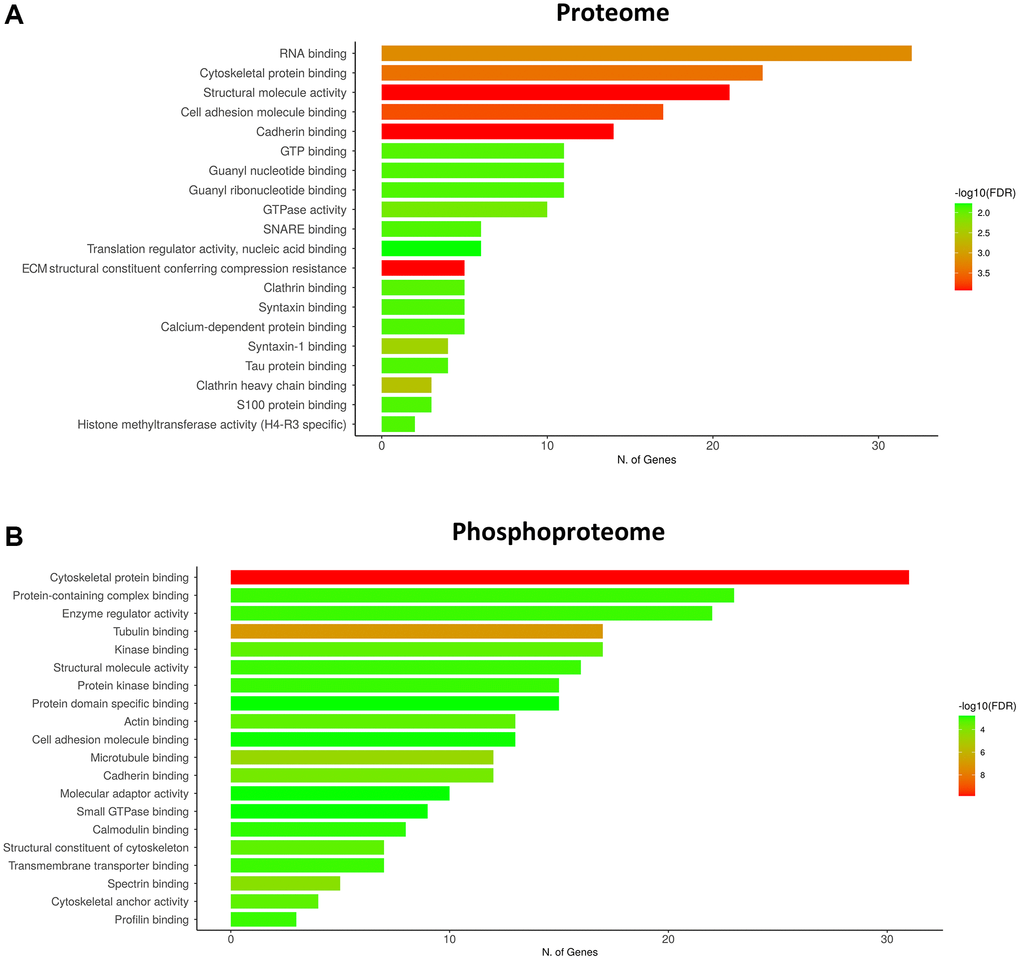
Figure 5. GO terms of the molecular functions of the main deregulated clusters in the late-elderly group (group 4). (A) Molecular functions of GO-enrichment analysis reveals that the main altered proteins in clusters 1 and 7 in late-elderly are related to cell membranes functions, vesicle and synaptic functions, RNA binding, and structural components. (B) Deregulated phosphoproteins in clusters 4 and 8 in the late-elderly group are principally connected with cytoskeleton composition and regulation, kinase regulation and membrane stabilization. Although GO is referred to gene ontology, we have chosen the term number of proteins instead to avoid confusions.
Individualized analysis of proteins with modified levels and phosphorylated proteins expressed in the FC at different aging stages
Deregulated proteins were individually categorized according to their localization and function in the CNS. Cytoskeletal (n = 47) and membrane proteins (n = 77), including proteins of the synapses and vesicles, myelin proteins, and proteins linked to membrane transport and ion channels, accounted for 124 differentially-expressed proteins. This classification was instrumental as some membrane proteins also participate in the structure of the synapses, and several synaptic proteins are plasma membrane proteins. Other deregulated proteins were related to DNA and RNA metabolism (n = 48), ubiquitin-proteasome-system (UPS) (n = 17), and kinases and phosphatases (n = 31). The remaining 83 proteins participated in other functions such as GTPases, fatty acid metabolism, and mitochondria. Their symbols, full names, and primary functions are summarized in Supplementary Tables 2–7.
The largest group of deregulated phosphoproteins were associated with the cytoskeleton and integral membrane proteins (n = 99), including in the first categorization, microfilaments, actin-binding proteins, intermediate filaments of neurons and glial cells, and microtubules. A second group was formed by phosphoproteins of the membranes, synapses, and dense core vesicles (n = 74). Other deregulated phosphoproteins were categorized as kinases and phosphatases (n = 36), proteins linked to DNA and RNA (n = 44), and members of the UPS (n = 16). The remaining 36 deregulated phosphoproteins involved GTPase regulation, inflammation, and lipid metabolism. Their symbols, full names, and primary functions are shown in Supplementary Tables 8–13.
Proteomic and phosphoproteomic data validation using Western blotting and immunohistochemistry
We validated changes in structural components of the cytoskeleton using gel electrophoresis and western blotting with antibodies anti-ermin (ERMN), β-tubulin III, and vimentin (VIM). Protein levels were assessed by densitometry, and a one-way ANOVA was performed to compare the effect of aging between groups on protein levels. One-way ANOVA revealed that there was a statistically significant difference in ERMN between at least two groups (F(3,9) = 5.912, p = 0.0164). Tukey’s HSD Test for multiple comparisons found that the mean value of ERMN was significantly different between late-elderly group (group 4) when compared with groups 1 and 2 (p < 0.05). β-tubulin III did not change with age (F(3,10) = 0.3102, p = 0.8176). Vimentin expression was increased in the three cases aged 47–85 and two cases aged 60–70. However, statistical analysis of all the samples did not show significant differences among the four groups (F(3,10) = 0.7277, p = 0.5584 (Figure 6A).
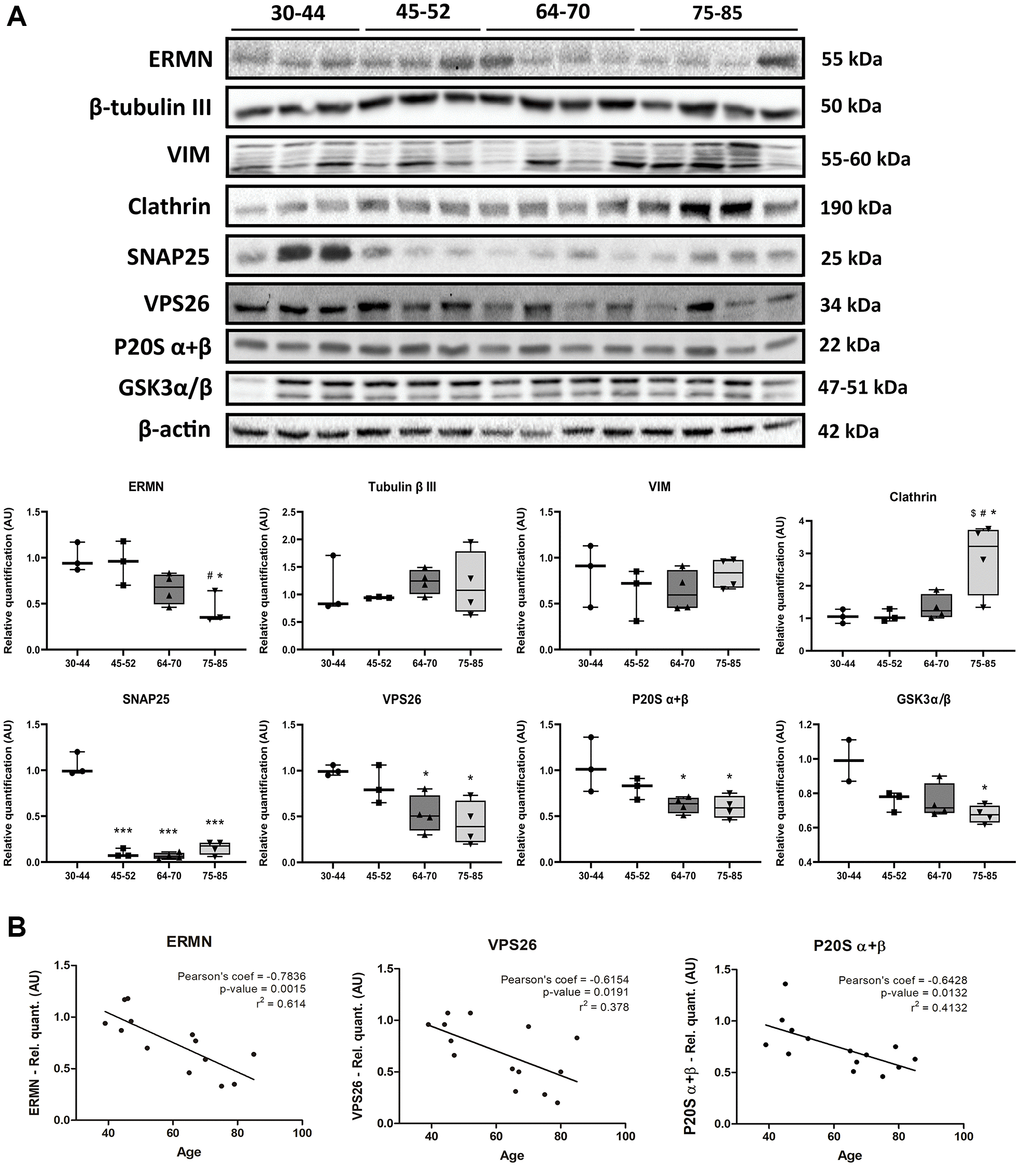
Figure 6. (A) Gel electrophoresis and western blotting to ermin (ERMN), β-tubulin III, vimentin (VIM), clathrin (heavy chain), SNAP25, VPS26, P20S α + β, and GSK3α/β in the FC area 8 across age; group 1 (young): 30–44y, group 2 (middle-aged: MA): 45–52y; group 3 (early-elderly): 64–70y; and group 4 (late-elderly): 75–85y. Significantly decreased expression levels of ERMN are found in group 4 compared with group 1 and group 2 (p < 0.05). Clathrin expression is significantly increased in group 4 compared with groups 1, 2, and 3 (p < 0.01). In contrast, there is a significant reduction of SNAP25 levels in groups 2, 3, and 4 compared with group 1 (p < 0.001), and VPS26 in groups 3 and 4 compared with group 1 (p < 0.05). P20S α + β levels are reduced in groups 3 and 4 compared with group 1 (p < 0.05). Similarly, reduced levels in GSK3α/β are observed in aging, reaching significant differences between group 1 and group 4 (p < 0.05). (B) Decreased levels of ERMN, VPS26 and P20S α + β significantly correlate with age. Pearson’s correlation significance level set at p < 0.05.
Levels of proteins related to vesicular components were also evaluated. One-way ANOVA revealed a significant difference in clathrin levels between at least two groups (F(3,10) = 6.566, p = 0.0099). Post-hoc Tukey’s test indicated that clathrin levels were significantly increased in the late-elderly group compared with groups 1, 2, and 3 (p < 0.05 for each group) (Figure 6A). One-way ANOVA test also showed a significant difference in SNAP25 and VPS26 levels between at least two groups (F(3,10) = 127.9, p < 0.0001) and (F(3,10) = 6.166, p = 0.0121), respectively). Tukey’s HSD Test for multiple comparisons found that the mean value of SNAP25 levels was significantly decreased groups 2, 3, and 4 (p < 0.001 for each group compared young group (group 1). Similarly, Tukey’s HSD Test for multiple comparisons found that VPS26 levels were significantly reduced comparing group 1 with group 3 (p < 0.05) and group 4 (p < 0.05) (Figure 6A).
Furthermore, the components of the proteasome system were also studied using western blotting. One-way ANOVA revealed no altered levels in the P19S proteasome protein (F(3,10) = 1.167, p = 0,3703), and LMP2 (F(3,10) = 1.193, p = 0,3614) and LMP7 (F(3,10) = 0.3329, p = 0.8019) inflammatory-modulated subunits (data not shown). In contrast, one-way ANOVA of the proteasome core P20S subunits α + β levels showed significantly decreased levels with aging (F(3,10) = 5.290, p = 0.0192). Tukey’s HSD Test for multiple comparisons verified P20S α + β levels significantly reduced when compared group 1 with group 3 (p < 0.05) and group 4 (p < 0.05) (Figure 6A).
Total GSK3α/β protein levels showed a tendency to decrease with age. A one-way ANOVA revealed significant differences in GSK3α/β protein levels between at least two groups (F(3,9) = 5.406, p = 0.0211). Tukey’s post-hoc test validated reduction in GSK3α/β protein levels in the group 4 when compared with group 1 (Figure 6A).
Protein levels of mitochondrial membrane VDAC and ATP synthase, and autophagy (ATG5) were also assessed by western blotting. One-way ANOVA disclosed no significant modifications in VDAC (F(3,10) = 2.054, p = 0.1703) and ATP synthase (F(3,10) = 0.7922, p = 0.5255). ATG5 protein levels were not modified with age (F(3,10) = 1.739, p = 0.2220) (data not shown).
The AT8 antibody did not detect immunoreactivity in any case excepting one rare case in group 1 (data not shown). The rare case was not accompanied by AT8 immunoreactivity in histological sections, and the reason of AT8 positivity remains unknown.
ERMN, VPS26, and P20S α + β protein levels were correlated with age (p = 0.0015, p = 0.0191 and p = 0.0132, respectively) (Figure 6B). The small number of cases per group (even lower than the number used for phosphoproteomics) does not permit robust conclusions. Antibodies directed against deregulated phosphoproteins identified in the present study were not available. Therefore, no attempt was made to validate (phospho)proteomics observations.
Discussion
The American Academy of Neurology estimates that MCI is present in about 8% of people aged 65 to 69, 15% of 75- to 79-year-olds, 25% of those aged 80 to 84, and about 37% of people older than 85 years of age. About 7.5% will develop dementia in the first year after diagnosis of MCI; about 15% will develop dementia in the second year; one-third will develop dementia due to sAD within five years. Between 25% and 50% of individuals over the age of 85 have dementia, most of them due to AD [48–50]. Most people at the age of 65 have ADNC at early NFT stages (I–III) without cognitive impairment; they are categorized as “normal brain aging” and accepted as “controls” in most clinical and pathological studies. However, only about 1% of individuals at the age 80/85 do not have ADNC [1, 2, 25].
Previous (phospho)proteomics studies in human brain aging have been conducted on human brain samples at different stages of NFT and SP pathology, including cases with first stages of ADNC (named “controls”) and subjects with middle and advanced stages of sAD. The present study used brain samples of individuals without neurological deficits and without NFTs and SPs in any region of the telencephalon (ABC score 0/0/0); moreover, cases did not have any other neuropathological change including TDP-43 proteinopathy (LATE), α-synucleinopathy, other tauopathies such as argyrophilic grain disease, frontotemporal lobar degeneration (FTLD), hippocampal sclerosis, and vascular diseases. We chose the FC because of its role in cognition and emotion and the abundant molecular information that permits comparison with other studies.
The primary specific limitation of the present approach is the small number of cases (n = 4 for every group). This is due to the rarity to find late-elderly individuals with no ADNC and without any other neuropathological lesion [51]. Due to their size, molecular properties, and methodological restraints, the limited capacity to detect numbers of proteins is a general curtailment of (phospho)proteomics studies, as well. Yet, the present observations have shown changes in the expression levels of a large number of proteins and the phosphorylation state, either hyper- or hypo-phosphorylation, of numerous proteins throughout brain aging: 308 differential expressed proteins and 306 phosphoproteins were identified when comparing all age groups. Notably, 280 differentially expressed proteins and 278 phosphopeptides were familiar to the four groups. Changes were not related to sex differences.
Human FC proteome with aging
Previous proteomic studies in human brain aging were focused on the identification protein pathways associated with cognitive decline and dementia [3–18]. Most of them analyzed different brain regions including the hippocampus, temporal cortex, and cerebellum not covered in the present study; and others examined the prefrontal cortex [8, 11, 12, 14]. One interesting study revealed two different pathways involved in Alzheimer’s dementia; one affecting β-amyloid deposition and another affecting resilience without a known pathological footprint [8]. Other studies stressed regional differences in the proteome profiles and linked cognitive impairment with altered expression of several cytoskeletal proteins [11, 14]. The prefrontal cortex was analyzed at early and advanced stages of NFT pathology, showing significant modifications in the level of proteins involved in catabolic processes, mRNA splicing, integrin-mediated signaling pathway, cytoskeleton, and synapse related-proteins at stages I-II [14]. In the same study, alterations in the expression of many other proteins occurred with disease progression [14]. Another study revealed mitochondrial protein alterations already present at early stages of AD that increased at advanced stages of the disease [12].
In the present study, proteins with altered expression levels in the FC during brain aging are components of the cytoskeleton, membranes, synapses, vesicles, myelin, and proteins linked to membrane transport and ion channels. Others connect with DNA and RNA metabolism, ubiquitin-proteasome-system (UPS), kinases, and phosphatases. The remaining abnormally expressed proteins participate in fatty acid metabolism, mitochondria, and GTPase functions. Therefore, our results fill the gap between brain ageing without ADNC, and cases with early and advanced stages of AD pathology. The relevant contribution of the present study deals with the identification of proteome alterations in the aged human frontal cortex in individuals with no neurological deficits, and without ADNC and other age-related neuropathological lesions.
The present study shows relative stable levels of proteins although with individual variations probably linked to the limited number of cases per group in the human FC in the two major clusters (named 1 and 7) until the age of 70. However, protein levels of functional components of cell membranes, vesicles and synapses, RNA modulation, and cellular structures (including tau and tubulin filaments) are markedly altered in the four individuals aged 75 or more. Furthermore, main alterations in the proteome are associated with proteins specific to neuronal populations, rather than those found in other cell types in the brain.
Comparison of these results with other published observations in AD cases identifies particular profiles in cases without ADNC. In AD, clathrin-mediated endocytosis decreases [52] whereas clathrin increases in non-ADNC cases. ERMN is an actin filament binding activity, involved in actin filament organization, mainly localized in oligodendroglia; decreased expression is in line with altered cytoskeleton with aging [53].
Damaged proteins are degraded by the ubiquitin-proteasome system which is key component of the proteostasis network. Proteasomal dysfunction is associated with an increased risk of protein aggregation, chronic inflammation, and the development of age-related diseases [54, 55]. Here, we analysed the protein levels of the 19-subunit regulatory particle, that recognizes substrates via a polyubiquitin tag [56], the immunoproteasome components LMP2 and LMP7 subunits [57], and the P20S α + β proteasome core [58]. The present findings show decreased expression of P20S α + β and preserved expression of P19S and immunoproteasome subunits LMP2 and LMP7 with aging. The relative preservation of the proteasome may act as a resilience mechanism in advanced aging protecting cells from the accumulation of altered proteins [55, 59–62].
Our preliminary observations assessing expression levels of ATG5, a crucial autophagy component, indicate no changes with age which contrast with the expected decline in aging-related neurological disorders [63]. Protein levels of some mitochondrial membranes were also altered at advanced ages in the proteomics study; however, VDAC and ATP synthase levels were preserved in western. It is contrast with mitochondrial dysfunction observed in aging and aging-related diseases [64]. The maintenance of these markers may indicate preservation of these pathways, in contrast to the observations in neurodegenerative disorders [65–72].
Finally, in addition to these results, we observed reduced levels of GSK3α/β. GSK3α/β is considered a key player in the pathophysiology of different age-related brain diseases since dysregulation of this kinase influences protein phosphorylation, neuroinflammation, neurogenesis, and alteration of synaptic function and memory, among others [73]. GSK3β is found to be hyperactive in the brains of AD patients [74], and its expression levels are known to increase with age [75]. Reduced levels of GSK3α/β may be understood as protective [76–80], and are in line with partial preservation of the proteasome, which is able to maintain GSK3β levels reduced [76].
However, the present study was carried out in the frontal cortex; therefore, we cannot rule out the possibility that additional or other changes may occur in different brain regions with aging.
Aged mice do not have ADNC; therefore, quantitative proteomics in the murine brain during aging provides non-biased information. Main alterations in old mice involve synaptic transmission, cytoskeleton, mitochondria and energy metabolism, oxidative stress, ribosome, transcriptional regulation, and GTPase function [81–83]. Therefore, proteome changes identified in the aged human frontal cortex are similar to those reported in the cerebral cortex of the aged murine brain.
Human FC phosphoproteome with aging
The individual categorization of deregulated phosphoproteins in the present study identifies many structural components of the cytoskeleton, including microfilaments, actin-binding proteins, intermediate filaments of neurons and glial cells, and microtubules; and phosphoproteins of the membranes, synapses, and dense core vesicles. Other deregulated phosphoproteins are kinases and phosphatases, proteins linked to DNA and RNA, and components of the UPS, phosphoproteins involved in GTPase regulation, inflammation, and lipid metabolism. Interestingly, only a few deregulated phosphoproteins also show altered expression levels, thus implying that protein expression levels and phosphorylation are modulated differently during human brain aging.
As indicated before, previous phosphoproteomics studies in human brain aging are representative of the phosphoproteome at different stages of ADNC including sAD [10, 32–37, 39]. Although with variations from one study to another, main deregulated phosphoproteins were associated with integral membrane proteins, glycoproteins, cytoskeletal proteins, synapsis, metabotropic glutamate receptor 5, calcium-signalling pathways, small heat shock proteins (HSP-27 and crystallin-αB), serine/threonine kinases, and mRNA processing and splicing [36, 37, 39].
In a previous study, the total number of identified deregulated phosphoproteins in the human FC in individuals with ADNC was 167, corresponding to 81 at NFT stages I-II, 92 at NFT stages III-IV, and 79 at NFT stages V-VI when compared with control cases without NFT and SP pathology [38]. The main group of deregulated phosphoproteins throughout sAD progression was composed of membrane proteins, proteins of the cytoskeleton, proteins of the synapses and dense core vesicles, and proteins linked to membrane transport and ion channels. Other deregulated phosphoproteins were kinases, proteins connected to DNA or protein deacetylation, proteins related to gene transcription and protein synthesis, heat-shock proteins, members of the UPS, and proteins involved in energy metabolism [38].
The control group (group 1) in the present study on brain aging without ADNC was aged 30–44, whereas the control group in our previous study was aged 33–79 years. Therefore, these control groups cannot be used as shared “controls”. Consequently, comparisons between the present findings and those of previous (phospho)proteomics studies are only approximate. Similarly to the observations in the proteome, changes in the phosphoproteome in the human FC show little variations until the age of 70. However, marked modifications occur in the larger phosphoprotein clusters 4 and 8 involving the cytoskeleton and neuronal structures, membrane stabilization, and kinase regulation in the late-elderly. Consistent with the observations in proteomic data, the analysis of altered phosphoproteins in cell populations revealed that the changes are mainly linked to neurons rather than to other brain cell types.
Considering phosphoproteome modifications in GO terms associated with cell functions and sub-cellular localization, the primary identified affected pathways are similar in brain aging without ADNC and progressive stages of sAD. However, main alterations in sAD and related murine models appear at the first stages of the disease and augment at the middle stages [38, 44]. Moreover, they involve particular systems linked to membrane proteins, membrane signalling, synapses, and cytoskeleton, in conjunction with activation of specific kinases involved in tau phosphorylation [38].
Similar phosphoproteomes are identified in other human and mouse tauopathies, although with disease-specific proteins [40, 41, 47]. A common unifying (phospho)protein in sAD and tauopathies is the early aberrant phosphorylation of tau with variable involvement of phosphorylation sites. The association of tau with the plasma membrane is determined by its phosphorylation pattern, and the phosphorylation state of membrane proteins, proteins linked to membrane signaling, and membrane specializations, together with the lipid composition of membranes, modulate tau phosphorylation [84–90]. Differences between present series without ADNC, and AD and tauopathies appear to be related to key modifications of membrane proteins, membrane signaling, and massive activation of specific tau kinases.
Altered phosphorylation occurs at early stages in other human neurodegenerative diseases and related mouse models [91–93]. Protein phosphorylation deregulation, involving cAMP signaling, dendrite development, and microtubule binding, precedes and extends pathology beyond the mutated polyglutamine tract in the cerebral cortex of Huntington’s disease transgenic mice [93]. Phosphoproteomics has also revealed that aberrant p25/Cdk5 signaling occurs in early-stage Parkinson’s disease in α-synuclein transgenic mice [92], whereas PINK1 regulates a subset of Rab GTPases [94]. The ultimate reason for the selective disease-specific altered protein phosphorylation remains unsolved. However, deregulated kinases play a principal role; the application of computational algorithms on phosphoproteomic data may permit the inference of kinase activity, facilitating the identification of deregulated kinases in various diseases [95].
Therefore, deregulated protein phosphorylation is universal in human brain aging and neurodegenerative diseases, but target proteins and molecular pathways involved are disease-dependent. The present observations identify proteostatic changes, including different changes in the phosphoproteome in the human FC in brain aging in the rare subpopulation of old-aged individuals without neurological deficits, and not having ADNC and other neuropathological change in any region of the telencephalon.
Materials and Methods
Human tissue samples
Donors included in the present study did not have neurological and mental complains, particularly they did not suffer from cognitive impairment, and they were able to carry out daily activities. The neurological examination at the time of admission in the hospital revealed no alterations. Causes of admission were variable including cardiac and respiratory diseases, infectious diseases, and malignancies. The causes of death were also variable and were attributed to cardiac, respiratory and multi-systemic failure.
The frozen frontal cortex of post-mortem samples was obtained from the Institute of Neuropathology HUB-ICO-IDIBELL Biobank following the guidelines of Spanish legislation on this matter and the approval of the local ethics committee (CEIC) of Bellvitge University Hospital. The post-mortem interval between death and tissue processing was between 2 h 45 min and 21 h. One hemisphere was immediately cut in coronal sections, 1 cm thick, and selected areas of the encephalon were rapidly dissected, frozen on metal plates over dry ice, placed in individual air-tight plastic bags, numbered with water-resistant ink, and stored at −80°C until used for biochemical studies. The other hemisphere was fixed by immersion in 4% buffered formalin for three weeks for morphologic study. The neuropathological study was carried out on paraffin sections of twenty-five selected regions of the cerebrum, cerebellum, brain stem, and spinal cord, which were stained with hematoxylin and eosin, Klüver-Barrera, and periodic acid Schiff, or processed for immunohistochemistry with anti-β-amyloid, phospho-tau (clone AT8), α-synuclein, αB-crystallin, neurofilament, internexin, TDP-43, TDP-43-P, ubiquitin, p62, glial fibrillary acidic protein, CD68, and IBA1 antibodies. Cases were selected from medium-class Caucasian individuals living in the city with no neurological and mental disorders and dying in the hospital due to distinct disorders mainly systemic neoplasia and infectious disease not affecting the nervous system.
The neuropathological examination revealed no AD-neuropathological changes (neurofibrillary tangles and senile plaques) in any region of the telencephalon (ABC score 0/0/0). Selected cases did not suffer from tauopathy, α-synucleinopathy, TDP-43 proteinopathy, frontotemporal lobar degeneration (FTLD), other neurodegenerative diseases, and vascular diseases affecting the nervous system excepting mild small blood vessel disease. In short, all cases were free from neurological and neuropathological disease. The cases were classified by age (years) in four groups (n = 4 cases/group): group 1 (young): 30–44; group 2 (middle-aged: MA): 45–52; group 3 (early-elderly): 64–70; and group 4 (late-elderly): 75–85. A summary of cases is shown in Table 1. The frontal cortex area 8 (and not the hippocampus) was chosen because of its role in cognition and emotion and the abundant molecular information that permits comparison with other studies.
Table 1. List of cases used in the analysis of the frontal cortex (phospho)proteome and Western blotting (WB) validation.
| Case | Sex | Age | Group | PMD | |||||||||||||||||||||||||||||||||||||||||||||||||||||||||||||||||||||||||||||||||||||||||||||||
| 1 | M | 30 | Group 1: young | 4 h 10 min | |||||||||||||||||||||||||||||||||||||||||||||||||||||||||||||||||||||||||||||||||||||||||||||||
| 2 | M | 36 | 2 h 45 min | ||||||||||||||||||||||||||||||||||||||||||||||||||||||||||||||||||||||||||||||||||||||||||||||||
| 3 | M | 39 | 3 h 30 min | ||||||||||||||||||||||||||||||||||||||||||||||||||||||||||||||||||||||||||||||||||||||||||||||||
| 4 | M | 44 | 6 h 40 min | ||||||||||||||||||||||||||||||||||||||||||||||||||||||||||||||||||||||||||||||||||||||||||||||||
| 5 | M | 45 | Group 2: middle-aged | 4 h 05 min | |||||||||||||||||||||||||||||||||||||||||||||||||||||||||||||||||||||||||||||||||||||||||||||||
| 6 | F | 46 | 7 h 15 min | ||||||||||||||||||||||||||||||||||||||||||||||||||||||||||||||||||||||||||||||||||||||||||||||||
| 7 | M | 47 | 4 h 55 min | ||||||||||||||||||||||||||||||||||||||||||||||||||||||||||||||||||||||||||||||||||||||||||||||||
| 8 | M | 52 | 4 h 40 min | ||||||||||||||||||||||||||||||||||||||||||||||||||||||||||||||||||||||||||||||||||||||||||||||||
| 9 | M | 64 | Group 3: early-elderly | 3 h 30 min | |||||||||||||||||||||||||||||||||||||||||||||||||||||||||||||||||||||||||||||||||||||||||||||||
| 10 | F | 66 | 8 h 00 min | ||||||||||||||||||||||||||||||||||||||||||||||||||||||||||||||||||||||||||||||||||||||||||||||||
| 11 | M | 67 | 5 h 00 min | ||||||||||||||||||||||||||||||||||||||||||||||||||||||||||||||||||||||||||||||||||||||||||||||||
| 12 | M | 70 | 13 h 00 min | ||||||||||||||||||||||||||||||||||||||||||||||||||||||||||||||||||||||||||||||||||||||||||||||||
| 13 | F | 75 | Group 4: late-elderly | 3 h 00 min | |||||||||||||||||||||||||||||||||||||||||||||||||||||||||||||||||||||||||||||||||||||||||||||||
| 14 | M | 79 | 7 h 00 min | ||||||||||||||||||||||||||||||||||||||||||||||||||||||||||||||||||||||||||||||||||||||||||||||||
| 15 | F | 80 | 21 h 00 min | ||||||||||||||||||||||||||||||||||||||||||||||||||||||||||||||||||||||||||||||||||||||||||||||||
| 16 | M | 85 | 5 h 45 min | ||||||||||||||||||||||||||||||||||||||||||||||||||||||||||||||||||||||||||||||||||||||||||||||||
| Abbreviation: PMD: post-mortem delay. Sample 1 was not available for WB. | |||||||||||||||||||||||||||||||||||||||||||||||||||||||||||||||||||||||||||||||||||||||||||||||||||
Phosphoproteomic analysis
FC samples were homogenized in a lysis buffer containing 7 M urea, 2 M thiourea, and 50 mM DTT supplemented with protease and phosphatase inhibitors. The High-Select™ TiO2 Phosphopeptide Enrichment Kit (Thermo Scientific, Barcelona, Spain) was used to obtain the phosphorylated peptide fractions, according to the manufacturer’s instructions. Protein extraction, in-solution digestion (600 μg), peptide purification, and reconstitution before mass spectrometric analysis were performed as previously described [38]. Prior to phosphopeptide enrichment, 10 μg of protein digest were separated for complete proteome analysis.
Phospho-peptide enriched and non-enriched (full proteome analysis) samples were analyzed by an LC-MS/MS Ultimate 3000 UHLPC System coupled to an Exploris480 mass spectrometer (Thermo Scientific, San Jose, CA, USA), by data-dependent analysis (DDA). Peptides were resolved using an C18 Acclaim PepMap 100 trap-column (100 μm × 2 cm, 5 μm, 100Å) and C18 Acclaim PepMap 100 column (75 μm × 500 mm, 2 μm, 100 Å; Thermo Scientific), using a 120-min gradient, at flow rate of 300 μl/min (40oC), consisting in: 5% to 20% B in 100 min, 20% to 32% B in 20 min and 32% to 90% B in 1 min (A = Formic 0.1%; B = Acetonitrile). DDA was set using many scans per duty cycle mode (n = 20). MS1-survey spectra were measured with a resolution of 120,000 (AGC target: 300%; maximum injection time: 60 ms; mass range: from 320 to 1500 m/z). After the survey scan, tandem MS was performed on the most abundant precursors (Isolation window: 1.4 m/z; charge state: + 2–6; collision energy: 30%). The resulting fragments were detected with a resolution of 30000 (First mass: 110 m/z; AGC target for MS/MS: 100%; maximum injection time: 60 ms). Dynamic exclusion was set to 30 sec with a 10 ppm mass tolerance around the precursor and its isotopes.
Raw files were processed with MaxQuant v 2.0.1 using the integrated Andromeda Search engine [96]. All data were searched against a target/decoy version of the Human Uniprot Reference Proteome with isoforms (Proteome ID: UP000005640_9606; March 2021). The first search peptide tolerance was set to 20 ppm, and the primary search peptide tolerance was set to 4.5 ppm. Fragment mass tolerance was set to 20 ppm. Trypsin was specified as the enzyme cleaving after all lysine and arginine residues allowing up to two missed cleavages. Carbamidomethylation of cysteine was defined as fixed modification, and peptide N-terminal acetylation, oxidation of methionine, deamidation of asparagine, glutamine and pyro-glutamate formation from glutamine and glutamate, and phosphorylation of serine, threonine, and tyrosine were considered variable modifications, with a total of 2 variable modifications per peptide. “Maximum peptide mass” was set to 7,500 Da, the “modified peptide minimum score” and “unmodified peptide minimum score” were set to 25, and everything else was put to the default values, including the false discovery rate limit of 1% on both the peptide and protein levels.
The Perseus software (version 1.6.14.0) was used for statistical analysis and data visualization [97]. One-way ANOVA test was applied to compare data between groups. Only (phospho)peptides with a p-value < 0.05 were considered differentially expressed. Proteomic experiments generate a large number of peptide or proteins that need to be evaluated independently using statistical tests maybe yielding type I errors [98]. However, it is important to note that due to the often-low power of proteomic experiments, the use of these corrections may fail to detect even true positives [99]. In this case, the use of only four samples per group, together with the low fold changes quantified in our data, were determinant for the statistical analysis; in consequence, the use of False Discovery Rate (FDR) corrections was not helpful in detecting significant phosphopeptides. MS data and search results files were deposited in the Proteome Xchange Consortium via the JPOST partner repository (https://repository.jpostdb.org) [100] with the identifier PXD035997 for ProteomeXchange and JPST001814 for jPOST (for reviewers: https://repository.jpostdb.org/preview/78674985762f6283a7330b; Access key: 8154).
Bioinformatics
The identification of significantly dysregulated regulatory/metabolic pathways in FC proteomic datasets was made using Metascape [101]. A cell-type enrichment analysis across frontal cortex differential datasets was performed using cell-type protein marker lists derived from four purified brain cell types: neuron, astrocyte, microglia, oligodendrocyte and endothelial cells [102, 103]. Functional analysis of altered clusters of proteins was performed using ShinyGO (v0.77) software [104].
Gel electrophoresis and immunoblotting
Frozen samples of frontal cortex area 8 at different patient ages (n = 14) were homogenized in RIPA lysis buffer composed of 50 mM Tris/HCl buffer, pH 7.4 containing 2 mM EDTA, 0.2% Nonidet P-40, 1 mM PMSF, protease and phosphatase inhibitor cocktail (Roche Molecular Systems, USA). The homogenates were centrifuged for 20 min at 20,000 × g. Protein concentration was determined with the BCA method (Thermo Scientific). Equal amounts of protein (12 μg) for each sample were loaded and separated by electrophoresis on 10% sodium dodecyl sulfate-polyacrylamide gel electrophoresis (SDS-PAGE) gels and then transferred onto nitrocellulose membranes (Amersham, Freiburg, GE). Non-specific bindings were blocked by incubating 3% albumin in PBS containing 0.2% Tween for one h at room temperature. After washing, the membranes were incubated overnight at 4°C with antibodies against primary antibodies summarized in Table 2. Protein loading was monitored using an antibody against β-actin. Membranes were incubated for one h with appropriate HRP-conjugated secondary antibodies (1:2,000, Dako, Barcelona, Spain); the immunoreaction was visualized with a chemiluminescence reagent (ECL, Amersham). Densitometric quantification was performed using the ImageLab v4.5.2 software (BioRad), using β-actin for normalization.
Table 2. List of antibodies used for Western blotting and immunohistochemistry.
| Antibody | Supplier | References | Species | Dil. WB | |||||||||||||||||||||||||||||||||||||||||||||||||||||||||||||||||||||||||||||||||||||||||||||||
| Clathrin (heavy chain) | BD Transduction | 610499 | Ms | 1/1,000 | |||||||||||||||||||||||||||||||||||||||||||||||||||||||||||||||||||||||||||||||||||||||||||||||
| Ermin (ERMN) | Abcam | ab243730 | Rb | 1/1,000 | |||||||||||||||||||||||||||||||||||||||||||||||||||||||||||||||||||||||||||||||||||||||||||||||
| SNAP25 | Chemicon | MAB331 | Ms | ½,000 | |||||||||||||||||||||||||||||||||||||||||||||||||||||||||||||||||||||||||||||||||||||||||||||||
| β-tubulin III | Signalway Antibody | 21617 | Rb | 1/1,000 | |||||||||||||||||||||||||||||||||||||||||||||||||||||||||||||||||||||||||||||||||||||||||||||||
| Vimentin | Abcam | ab137321 | Rb | 1/3,000 | |||||||||||||||||||||||||||||||||||||||||||||||||||||||||||||||||||||||||||||||||||||||||||||||
| VPS26 | Genetex | GTX106297 | Rb | ½,000 | |||||||||||||||||||||||||||||||||||||||||||||||||||||||||||||||||||||||||||||||||||||||||||||||
| β-actin | Sigma | A5316 | Ms | 1/30,000 | |||||||||||||||||||||||||||||||||||||||||||||||||||||||||||||||||||||||||||||||||||||||||||||||
| AT8 | Innogenetics | 90206 | Ms | 1/1,000 | |||||||||||||||||||||||||||||||||||||||||||||||||||||||||||||||||||||||||||||||||||||||||||||||
| P20S α+β | Abcam | ab22673 | Rb | 1/1,1000 | |||||||||||||||||||||||||||||||||||||||||||||||||||||||||||||||||||||||||||||||||||||||||||||||
| P19S | Abcam | ab3317 | Rb | 1/1,000 | |||||||||||||||||||||||||||||||||||||||||||||||||||||||||||||||||||||||||||||||||||||||||||||||
| P20S LMP2 | Abcam | ab3328 | Rb | 1/500 | |||||||||||||||||||||||||||||||||||||||||||||||||||||||||||||||||||||||||||||||||||||||||||||||
| P20S LMP7 | Abcam | ab3329 | Rb | 1/500 | |||||||||||||||||||||||||||||||||||||||||||||||||||||||||||||||||||||||||||||||||||||||||||||||
| ATG5 | Cell Signaling | #12994 | Rb | 1/1,000 | |||||||||||||||||||||||||||||||||||||||||||||||||||||||||||||||||||||||||||||||||||||||||||||||
| GSK3α/β | Santa Cruz Biotech. | SC7291 | Ms | 1/1,000 | |||||||||||||||||||||||||||||||||||||||||||||||||||||||||||||||||||||||||||||||||||||||||||||||
| VDAC | Abcam | ab15895 | Rb | 1/500 | |||||||||||||||||||||||||||||||||||||||||||||||||||||||||||||||||||||||||||||||||||||||||||||||
| ATP synthase | Biosciences | 612516 | Ms | 1/10,000 | |||||||||||||||||||||||||||||||||||||||||||||||||||||||||||||||||||||||||||||||||||||||||||||||
| Abbreviations: Ms: mouse monoclonal; Rb: rabbit polyclonal; Dil. WB: dilution Western blotting. BD Transduction: http://www.bdbiosciences.com; Abcam: https://www.abcam.com; Chemicon: https://chemicongroup.com; Signalway: https://www.sabbiotech.com; Genetex: https://www.genetex.com; Sigma: https://www.sigmaaldrich.com. | |||||||||||||||||||||||||||||||||||||||||||||||||||||||||||||||||||||||||||||||||||||||||||||||||||
Statistical analysis
The normality of distribution was analyzed with the Kolmogorov-Smirnov test. The statistical analysis of protein levels between groups was carried out using a one-way analysis of variance (ANOVA) followed by a Tukey post-test using the GraphPad Prism software version 9.5.0 (La Jolla, CA, USA). Graphic design was performed with GraphPad Prism version 9.5.0 (La Jolla, CA, USA). Outliers were detected using the GraphPad software QuickCalcs (p < 0.05). Data were expressed as mean ± SEM. When comparing between age groups, differences were considered statistically significant when compared one age group (for example late-elderly (group 4) with young (group 1) at *p < 0.05, **p < 0.01, ***p < 0.001; with MA (group 2) at #p < 0.05, and ##p < 0.01; and with early-elderly (group 3) at $p < 0.05, and $$p < 0.01. Pearson’s correlation coefficient was used to assess associations between protein levels and age. Pearson’s correlation significance levels were set at *p < 0.05, **p < 0.01, and ***p < 0.001.
Data availability statement
All data are available in the main manuscript, and supplementary Figures and Tables.
Author Contributions
All authors contributed to the study conception and design. Ferrer I and Andrés-Benito P designed the study; del Rio JA, Andrés-Benito P and Ferrer I refined the conceptualization of the whole experiment; Andrés-Benito P, Brullas M, Carmona M and Povedano M participated in sample processing, data collection and analysis; Íñigo-Marco I, Fernández-Irigoyen J and Santamaría E performed proteomics and phosphoproteomics experiments and data processing; Andrés-Benito P and Ferrer I wrote the first draft of the manuscript. All authors read and approved the final manuscript.
Acknowledgments
We thank Tom Yohannan for editing corrections.
Conflicts of Interest
The authors declare no conflicts of interest related to this study.
Ethical Statement
Post-mortem brain samples were obtained from the Institute of Neuropathology HUB-ICO-IDIBELL Biobank following the guidelines of Spanish legislation on this matter (Real Decreto 1716/2011), and the approval of the local ethics committee (CEIC) of Bellvitge University Hospital.
Funding
The project leading to these results received funding from the “la Caixa” Foundation (ID 100010434) under the agreement LCF/PR/HR19/52160007, HR18-00452 to IF and JAdR. We thank CERCA Programme/Generalitat de Catalunya for institutional support. The Proteomics Platform of Navarrabiomed is a member of Proteored (PRB3-ISCIII) and is supported by grant PT17/0019/009 to JFI, of the PE I+D+I 2013–2016 funded by ISCIII and FEDER. Parts of this work were funded by a grant from the Spanish Ministry of Science Innovation and Universities (Ref. PID2019-110356RB-I00) to JFI and ES, and the Department of Economic and Business Development of the Government of Navarra (Ref. 0011-1411-2020-000028) to ES.
References
- 1. Ferrer I. Alzheimer’s disease is an inherent, natural part of human brain aging: an integrated perspective. Free Neuropathology. 2022; 3:17. https://doi.org/10.17879/freeneuropathology-2022-3806
- 2. Ferrer I. Hypothesis review: Alzheimer's overture guidelines. Brain Pathol. 2023; 33:e13122. https://doi.org/10.1111/bpa.13122 [PubMed]
- 3. Schonberger SJ, Edgar PF, Kydd R, Faull RL, Cooper GJ. Proteomic analysis of the brain in Alzheimer's disease: molecular phenotype of a complex disease process. Proteomics. 2001; 1:1519–28. https://doi.org/10.1002/1615-9861(200111)1:12%3c1519::aid-prot1519%3e3.0.co;2-l [PubMed]
- 4. Begcevic I, Kosanam H, Martínez-Morillo E, Dimitromanolakis A, Diamandis P, Kuzmanov U, Hazrati LN, Diamandis EP. Semiquantitative proteomic analysis of human hippocampal tissues from Alzheimer's disease and age-matched control brains. Clin Proteomics. 2013; 10:5. https://doi.org/10.1186/1559-0275-10-5 [PubMed]
- 5. Musunuri S, Wetterhall M, Ingelsson M, Lannfelt L, Artemenko K, Bergquist J, Kultima K, Shevchenko G. Quantification of the brain proteome in Alzheimer's disease using multiplexed mass spectrometry. J Proteome Res. 2014; 13:2056–68. https://doi.org/10.1021/pr401202d [PubMed]
- 6. Hondius DC, van Nierop P, Li KW, Hoozemans JJ, van der Schors RC, van Haastert ES, van der Vies SM, Rozemuller AJ, Smit AB. Profiling the human hippocampal proteome at all pathologic stages of Alzheimer's disease. Alzheimers Dement. 2016; 12:654–68. https://doi.org/10.1016/j.jalz.2015.11.002 [PubMed]
- 7. Xu B, Xiong F, Tian R, Zhan S, Gao Y, Qiu W, Wang R, Ge W, Ma C. Temporal lobe in human aging: A quantitative protein profiling study of samples from Chinese Human Brain Bank. Exp Gerontol. 2016; 73:31–41. https://doi.org/10.1016/j.exger.2015.11.016 [PubMed]
- 8. Yu L, Petyuk VA, Gaiteri C, Mostafavi S, Young-Pearse T, Shah RC, Buchman AS, Schneider JA, Piehowski PD, Sontag RL, Fillmore TL, Shi T, Smith RD, et al. Targeted brain proteomics uncover multiple pathways to Alzheimer's dementia. Ann Neurol. 2018; 84:78–88. https://doi.org/10.1002/ana.25266 [PubMed]
- 9. Ping L, Duong DM, Yin L, Gearing M, Lah JJ, Levey AI, Seyfried NT. Global quantitative analysis of the human brain proteome in Alzheimer’s and Parkinson’s Disease. Sci Data. 2018; 5:180036. https://doi.org/10.1038/sdata.2018.36 [PubMed]
- 10. Ping L, Kundinger SR, Duong DM, Yin L, Gearing M, Lah JJ, Levey AI, Seyfried NT. Global quantitative analysis of the human brain proteome and phosphoproteome in Alzheimer's disease. Sci Data. 2020; 7:315. https://doi.org/10.1038/s41597-020-00650-8 [PubMed]
- 11. McKetney J, Runde RM, Hebert AS, Salamat S, Roy S, Coon JJ. Proteomic Atlas of the Human Brain in Alzheimer's Disease. J Proteome Res. 2019; 18:1380–91. https://doi.org/10.1021/acs.jproteome.9b00004 [PubMed]
- 12. Adav SS, Park JE, Sze SK. Quantitative profiling brain proteomes revealed mitochondrial dysfunction in Alzheimer's disease. Mol Brain. 2019; 12:8. https://doi.org/10.1186/s13041-019-0430-y [PubMed]
- 13. Wingo AP, Dammer EB, Breen MS, Logsdon BA, Duong DM, Troncosco JC, Thambisetty M, Beach TG, Serrano GE, Reiman EM, Caselli RJ, Lah JJ, Seyfried NT, et al. Large-scale proteomic analysis of human brain identifies proteins associated with cognitive trajectory in advanced age. Nat Commun. 2019; 10:1619. https://doi.org/10.1038/s41467-019-09613-z [PubMed]
- 14. Mendonça CF, Kuras M, Nogueira FCS, Plá I, Hortobágyi T, Csiba L, Palkovits M, Renner É, Döme P, Marko-Varga G, Domont GB, Rezeli M. Proteomic signatures of brain regions affected by tau pathology in early and late stages of Alzheimer's disease. Neurobiol Dis. 2019; 130:104509. https://doi.org/10.1016/j.nbd.2019.104509 [PubMed]
- 15. Wingo AP, Liu Y, Gerasimov ES, Gockley J, Logsdon BA, Duong DM, Dammer EB, Robins C, Beach TG, Reiman EM, Epstein MP, De Jager PL, Lah JJ, et al. Integrating human brain proteomes with genome-wide association data implicates new proteins in Alzheimer's disease pathogenesis. Nat Genet. 2021; 53:143–6. https://doi.org/10.1038/s41588-020-00773-z [PubMed]
- 16. Roberts JA, Varma VR, An Y, Varma S, Candia J, Fantoni G, Tiwari V, Anerillas C, Williamson A, Saito A, Loeffler T, Schilcher I, Moaddel R, et al. A brain proteomic signature of incipient Alzheimer's disease in young APOE ε4 carriers identifies novel drug targets. Sci Adv. 2021; 7:eabi8178. https://doi.org/10.1126/sciadv.abi8178 [PubMed]
- 17. Velásquez E, Szeitz B, Gil J, Rodriguez J, Palkovits M, Renner É, Hortobágyi T, Döme P, Nogueira FC, Marko-Varga G, Domont GB, Rezeli M. Topological Dissection of Proteomic Changes Linked to the Limbic Stage of Alzheimer's Disease. Front Immunol. 2021; 12:750665. https://doi.org/10.3389/fimmu.2021.750665 [PubMed]
- 18. Gao Y, Liu J, Wang J, Liu Y, Zeng LH, Ge W, Ma C. Proteomic analysis of human hippocampal subfields provides new insights into the pathogenesis of Alzheimer's disease and the role of glial cells. Brain Pathol. 2022; 32:e13047. https://doi.org/10.1111/bpa.13047 [PubMed]
- 19. Braak H, Braak E. Neuropathological stageing of Alzheimer-related changes. Acta Neuropathol. 1991; 82:239–59. https://doi.org/10.1007/BF00308809 [PubMed]
- 20. Braak H, Braak E. Frequency of stages of Alzheimer-related lesions in different age categories. Neurobiol Aging. 1997; 18:351–7. https://doi.org/10.1016/s0197-4580(97)00056-0 [PubMed]
- 21. Braak H, Thal DR, Ghebremedhin E, Del Tredici K. Stages of the pathologic process in Alzheimer disease: age categories from 1 to 100 years. J Neuropathol Exp Neurol. 2011; 70:960–9. https://doi.org/10.1097/NEN.0b013e318232a379 [PubMed]
- 22. Ferrer I. Defining Alzheimer as a common age-related neurodegenerative process not inevitably leading to dementia. Prog Neurobiol. 2012; 97:38–51. https://doi.org/10.1016/j.pneurobio.2012.03.005 [PubMed]
- 23. Braak H, Del Tredici K. The preclinical phase of the pathological process underlying sporadic Alzheimer's disease. Brain. 2015; 138:2814–33. https://doi.org/10.1093/brain/awv236 [PubMed]
- 24. Braak H, Del Tredici K. Neuroanatomy and pathology of sporadic Alzheimer's disease. Adv Anat Embryol Cell Biol. 2015; 215:1–162. [PubMed]
- 25. Arnsten AFT, Datta D, Del Tredici K, Braak H. Hypothesis: Tau pathology is an initiating factor in sporadic Alzheimer's disease. Alzheimers Dement. 2021; 17:115–24. https://doi.org/10.1002/alz.12192 [PubMed]
- 26. Cohen P. The regulation of protein function by multisite phosphorylation--a 25 year update. Trends Biochem Sci. 2000; 25:596–601. https://doi.org/10.1016/s0968-0004(00)01712-6 [PubMed]
- 27. Johnson LN, Lewis RJ. Structural basis for control by phosphorylation. Chem Rev. 2001; 101:2209–42. https://doi.org/10.1021/cr000225s [PubMed]
- 28. Manning G, Whyte DB, Martinez R, Hunter T, Sudarsanam S. The protein kinase complement of the human genome. Science. 2002; 298:1912–34. https://doi.org/10.1126/science.1075762 [PubMed]
- 29. Yaffe MB. Phosphotyrosine-binding domains in signal transduction. Nat Rev Mol Cell Biol. 2002; 3:177–86. https://doi.org/10.1038/nrm759 [PubMed]
- 30. Kapuy O, Barik D, Sananes MR, Tyson JJ, Novák B. Bistability by multiple phosphorylation of regulatory proteins. Prog Biophys Mol Biol. 2009; 100:47–56. https://doi.org/10.1016/j.pbiomolbio.2009.06.004 [PubMed]
- 31. Salazar C, Höfer T. Multisite protein phosphorylation--from molecular mechanisms to kinetic models. FEBS J. 2009; 276:3177–98. https://doi.org/10.1111/j.1742-4658.2009.07027.x [PubMed]
- 32. Di Domenico F, Sultana R, Barone E, Perluigi M, Cini C, Mancuso C, Cai J, Pierce WM, Butterfield DA. Quantitative proteomics analysis of phosphorylated proteins in the hippocampus of Alzheimer's disease subjects. J Proteomics. 2011; 74:1091–103. https://doi.org/10.1016/j.jprot.2011.03.033 [PubMed]
- 33. Zahid S, Oellerich M, Asif AR, Ahmed N. Phosphoproteome profiling of substantia nigra and cortex regions of Alzheimer's disease patients. J Neurochem. 2012; 121:954–63. https://doi.org/10.1111/j.1471-4159.2012.07737.x [PubMed]
- 34. Tan H, Wu Z, Wang H, Bai B, Li Y, Wang X, Zhai B, Beach TG, Peng J. Refined phosphopeptide enrichment by phosphate additive and the analysis of human brain phosphoproteome. Proteomics. 2015; 15:500–7. https://doi.org/10.1002/pmic.201400171 [PubMed]
- 35. Triplett JC, Swomley AM, Cai J, Klein JB, Butterfield DA. Quantitative phosphoproteomic analyses of the inferior parietal lobule from three different pathological stages of Alzheimer's disease. J Alzheimers Dis. 2016; 49:45–62. https://doi.org/10.3233/JAD-150417 [PubMed]
- 36. Dammer EB, Lee AK, Duong DM, Gearing M, Lah JJ, Levey AI, Seyfried NT. Quantitative phosphoproteomics of Alzheimer's disease reveals cross-talk between kinases and small heat shock proteins. Proteomics. 2015; 15:508–19. https://doi.org/10.1002/pmic.201400189 [PubMed]
- 37. Bai B, Wang X, Li Y, Chen PC, Yu K, Dey KK, Yarbro JM, Han X, Lutz BM, Rao S, Jiao Y, Sifford JM, Han J, et al. Deep Multilayer Brain Proteomics Identifies Molecular Networks in Alzheimer's Disease Progression. Neuron. 2020; 105:975–91.e7. https://doi.org/10.1016/j.neuron.2019.12.015 [PubMed]
- 38. Ferrer I, Andrés-Benito P, Ausín K, Pamplona R, Del Rio JA, Fernández-Irigoyen J, Santamaría E. Dysregulated protein phosphorylation: A determining condition in the continuum of brain aging and Alzheimer's disease. Brain Pathol. 2021; 31:e12996. https://doi.org/10.1111/bpa.12996 [PubMed]
- 39. Sathe G, Mangalaparthi KK, Jain A, Darrow J, Troncoso J, Albert M, Moghekar A, Pandey A. Multiplexed Phosphoproteomic Study of Brain in Patients with Alzheimer's Disease and Age-Matched Cognitively Healthy Controls. OMICS. 2020; 24:216–27. https://doi.org/10.1089/omi.2019.0191 [PubMed]
- 40. Ferrer I, García MA, González IL, Lucena DD, Villalonga AR, Tech MC, Llorens F, Garcia-Esparcia P, Martinez-Maldonado A, Mendez MF, Escribano BT, Bech-Serra JJ, Sabido E, et al. Aging-related tau astrogliopathy (ARTAG): not only tau phosphorylation in astrocytes. Brain Pathol. 2018; 28:965–85. https://doi.org/10.1111/bpa.12593 [PubMed]
- 41. Ferrer I, Andrés-Benito P, Zelaya MV, Aguirre MEE, Carmona M, Ausín K, Lachén-Montes M, Fernández-Irigoyen J, Santamaría E, Del Rio JA. Familial globular glial tauopathy linked to MAPT mutations: molecular neuropathology and seeding capacity of a prototypical mixed neuronal and glial tauopathy. Acta Neuropathol. 2020; 139:735–71. https://doi.org/10.1007/s00401-019-02122-9 [PubMed]
- 42. Wang F, Blanchard AP, Elisma F, Granger M, Xu H, Bennett SA, Figeys D, Zou H. Phosphoproteome analysis of an early onset mouse model (TgCRND8) of Alzheimer's disease reveals temporal changes in neuronal and glia signaling pathways. Proteomics. 2013; 13:1292–305. https://doi.org/10.1002/pmic.201200415 [PubMed]
- 43. Hoos MD, Richardson BM, Foster MW, Everhart A, Thompson JW, Moseley MA, Colton CA. Longitudinal study of differential protein expression in an Alzheimer's mouse model lacking inducible nitric oxide synthase. J Proteome Res. 2013; 12:4462–77. https://doi.org/10.1021/pr4005103 [PubMed]
- 44. Tagawa K, Homma H, Saito A, Fujita K, Chen X, Imoto S, Oka T, Ito H, Motoki K, Yoshida C, Hatsuta H, Murayama S, Iwatsubo T, et al. Comprehensive phosphoproteome analysis unravels the core signaling network that initiates the earliest synapse pathology in preclinical Alzheimer's disease brain. Hum Mol Genet. 2015; 24:540–58. https://doi.org/10.1093/hmg/ddu475 [PubMed]
- 45. Kempf SJ, Metaxas A, Ibáñez-Vea M, Darvesh S, Finsen B, Larsen MR. An integrated proteomics approach shows synaptic plasticity changes in an APP/PS1 Alzheimer's mouse model. Oncotarget. 2016; 7:33627–48. https://doi.org/10.18632/oncotarget.9092 [PubMed]
- 46. Chen Y, Xu J, Zhou X, Liu S, Zhang Y, Ma S, Fu AKY, Ip NY, Chen Y. Changes of Protein Phosphorylation Are Associated with Synaptic Functions during the Early Stage of Alzheimer's Disease. ACS Chem Neurosci. 2019; 10:3986–96. https://doi.org/10.1021/acschemneuro.9b00190 [PubMed]
- 47. Ferrer I, Andrés-Benito P, Ausín K, Cartas-Cejudo P, Lachén-Montes M, Del Rio JA, Fernández-Irigoyen J, Santamaría E. Dysregulated Protein Phosphorylation in a Mouse Model of FTLD-Tau. J Neuropathol Exp Neurol. 2022; 81:696–706. https://doi.org/10.1093/jnen/nlac062 [PubMed]
- 48. Knopman DS, Amieva H, Petersen RC, Chételat G, Holtzman DM, Hyman BT, Nixon RA, Jones DT. Alzheimer disease. Nat Rev Dis Primers. 2021; 7:33. https://doi.org/10.1038/s41572-021-00269-y [PubMed]
- 49. Ward A, Tardiff S, Dye C, Arrighi HM. Rate of conversion from prodromal Alzheimer's disease to Alzheimer's dementia: a systematic review of the literature. Dement Geriatr Cogn Dis Extra. 2013; 3:320–32. https://doi.org/10.1159/000354370 [PubMed]
- 50. Petersen RC, Lopez O, Armstrong MJ, Getchius TSD, Ganguli M, Gloss D, Gronseth GS, Marson D, Pringsheim T, Day GS, Sager M, Stevens J, Rae-Grant A. Practice guideline update summary: Mild cognitive impairment: Report of the Guideline Development, Dissemination, and Implementation Subcommittee of the American Academy of Neurology. Neurology. 2018; 90:126–35. https://doi.org/10.1212/WNL.0000000000004826 [PubMed]
- 51. I F. The unique neuropathological vulnerability of the human brain to aging. Ageing Res Rev. 2023; 87:101916. https://doi.org/10.1016/j.arr.2023.101916 [PubMed]
- 52. Cao Y, Xiao Y, Ravid R, Guan ZZ. Changed clathrin regulatory proteins in the brains of Alzheimer's disease patients and animal models. J Alzheimers Dis. 2010; 22:329–42. https://doi.org/10.3233/JAD-2010-100162 [PubMed]
- 53. Wang T, Jia L, Lv B, Liu B, Wang W, Wang F, Yang G, Bu X, Yao L, Zhang B. Human Ermin (hErmin), a new oligodendrocyte-specific cytoskeletal protein related to epileptic seizure. Brain Res. 2011; 1367:77–84. https://doi.org/10.1016/j.brainres.2010.10.003 [PubMed]
- 54. Vilchez D, Saez I, Dillin A. The role of protein clearance mechanisms in organismal ageing and age-related diseases. Nat Commun. 2014; 5:5659. https://doi.org/10.1038/ncomms6659 [PubMed]
- 55. Saez I, Vilchez D. The Mechanistic Links Between Proteasome Activity, Aging and Age-related Diseases. Curr Genomics. 2014; 15:38–51. https://doi.org/10.2174/138920291501140306113344 [PubMed]
- 56. Martinez-Fonts K, Davis C, Tomita T, Elsasser S, Nager AR, Shi Y, Finley D, Matouschek A. The proteasome 19S cap and its ubiquitin receptors provide a versatile recognition platform for substrates. Nat Commun. 2020; 11:477. https://doi.org/10.1038/s41467-019-13906-8 [PubMed]
- 57. Yewdell J, Lapham C, Bacik I, Spies T, Bennink J. MHC-encoded proteasome subunits LMP2 and LMP7 are not required for efficient antigen presentation. J Immunol. 1994; 152:1163–70. https://doi.org/10.4049/jimmunol.152.3.1163 [PubMed]
- 58. Latham MP, Sekhar A, Kay LE. Understanding the mechanism of proteasome 20S core particle gating. Proc Natl Acad Sci U S A. 2014; 111:5532–7. https://doi.org/10.1073/pnas.1322079111 [PubMed]
- 59. Zheng Q, Huang T, Zhang L, Zhou Y, Luo H, Xu H, Wang X. Dysregulation of Ubiquitin-Proteasome System in Neurodegenerative Diseases. Front Aging Neurosci. 2016; 8:303. https://doi.org/10.3389/fnagi.2016.00303 [PubMed]
- 60. Rao G, Croft B, Teng C, Awasthi V. Ubiquitin-Proteasome System in Neurodegenerative Disorders. J Drug Metab Toxicol. 2015; 6:187. https://doi.org/10.4172/2157-7609.1000187 [PubMed]
- 61. Schmidt MF, Gan ZY, Komander D, Dewson G. Ubiquitin signalling in neurodegeneration: mechanisms and therapeutic opportunities. Cell Death Differ. 2021; 28:570–90. https://doi.org/10.1038/s41418-020-00706-7 [PubMed]
- 62. Fernández-Cruz I, Reynaud E. Proteasome Subunits Involved in Neurodegenerative Diseases. Arch Med Res. 2021; 52:1–14. https://doi.org/10.1016/j.arcmed.2020.09.007 [PubMed]
- 63. Barbosa MC, Grosso RA, Fader CM. Hallmarks of Aging: An Autophagic Perspective. Front Endocrinol (Lausanne). 2019; 9:790. https://doi.org/10.3389/fendo.2018.00790 [PubMed]
- 64. Chistiakov DA, Sobenin IA, Revin VV, Orekhov AN, Bobryshev YV. Mitochondrial aging and age-related dysfunction of mitochondria. Biomed Res Int. 2014; 2014:238463. https://doi.org/10.1155/2014/238463 [PubMed]
- 65. Wilkins HM, Morris JK. New Therapeutics to Modulate Mitochondrial Function in Neurodegenerative Disorders. Curr Pharm Des. 2017; 23:731–52. https://doi.org/10.2174/1381612822666161230144517 [PubMed]
- 66. Bazzani V, Equisoain Redin M, McHale J, Perrone L, Vascotto C. Mitochondrial DNA Repair in Neurodegenerative Diseases and Ageing. Int J Mol Sci. 2022; 23:11391. https://doi.org/10.3390/ijms231911391 [PubMed]
- 67. Corona JC, Duchen MR. PPARγ as a therapeutic target to rescue mitochondrial function in neurological disease. Free Radic Biol Med. 2016; 100:153–63. https://doi.org/10.1016/j.freeradbiomed.2016.06.023 [PubMed]
- 68. Moreira PI, Zhu X, Wang X, Lee HG, Nunomura A, Petersen RB, Perry G, Smith MA. Mitochondria: a therapeutic target in neurodegeneration. Biochim Biophys Acta. 2010; 1802:212–20. https://doi.org/10.1016/j.bbadis.2009.10.007 [PubMed]
- 69. Bastien J, Menon S, Messa M, Nyfeler B. Molecular targets and approaches to restore autophagy and lysosomal capacity in neurodegenerative disorders. Mol Aspects Med. 2021; 82:101018. https://doi.org/10.1016/j.mam.2021.101018 [PubMed]
- 70. Scrivo A, Bourdenx M, Pampliega O, Cuervo AM. Selective autophagy as a potential therapeutic target for neurodegenerative disorders. Lancet Neurol. 2018; 17:802–15. https://doi.org/10.1016/S1474-4422(18)30238-2 [PubMed]
- 71. Nah J, Yuan J, Jung YK. Autophagy in neurodegenerative diseases: from mechanism to therapeutic approach. Mol Cells. 2015; 38:381–9. https://doi.org/10.14348/molcells.2015.0034 [PubMed]
- 72. Guo F, Liu X, Cai H, Le W. Autophagy in neurodegenerative diseases: pathogenesis and therapy. Brain Pathol. 2018; 28:3–13. https://doi.org/10.1111/bpa.12545 [PubMed]
- 73. Lauretti E, Dincer O, Praticò D. Glycogen synthase kinase-3 signaling in Alzheimer's disease. Biochim Biophys Acta Mol Cell Res. 2020; 1867:118664. https://doi.org/10.1016/j.bbamcr.2020.118664 [PubMed]
- 74. Leroy K, Yilmaz Z, Brion JP. Increased level of active GSK-3beta in Alzheimer's disease and accumulation in argyrophilic grains and in neurones at different stages of neurofibrillary degeneration. Neuropathol Appl Neurobiol. 2007; 33:43–55. https://doi.org/10.1111/j.1365-2990.2006.00795.x [PubMed]
- 75. Lee SJ, Chung YH, Joo KM, Lim HC, Jeon GS, Kim D, Lee WB, Kim YS, Cha CI. Age-related changes in glycogen synthase kinase 3beta (GSK3beta) immunoreactivity in the central nervous system of rats. Neurosci Lett. 2006; 409:134–9. https://doi.org/10.1016/j.neulet.2006.09.026 [PubMed]
- 76. Lv Y, Meng B, Dong H, Jing T, Wu N, Yang Y, Huang L, Moses RE, O'Malley BW, Mei B, Li X. Upregulation of GSK3β Contributes to Brain Disorders in Elderly REGγ-knockout Mice. Neuropsychopharmacology. 2016; 41:1340–9. https://doi.org/10.1038/npp.2015.285 [PubMed]
- 77. Tam ZY, Gruber J, Ng LF, Halliwell B, Gunawan R. Effects of lithium on age-related decline in mitochondrial turnover and function in Caenorhabditis elegans. J Gerontol A Biol Sci Med Sci. 2014; 69:810–20. https://doi.org/10.1093/gerona/glt210 [PubMed]
- 78. McColl G, Killilea DW, Hubbard AE, Vantipalli MC, Melov S, Lithgow GJ. Pharmacogenetic analysis of lithium-induced delayed aging in Caenorhabditis elegans. J Biol Chem. 2008; 283:350–7. https://doi.org/10.1074/jbc.M705028200 [PubMed]
- 79. Martin SA, DeMuth TM, Miller KN, Pugh TD, Polewski MA, Colman RJ, Eliceiri KW, Beasley TM, Johnson SC, Anderson RM. Regional metabolic heterogeneity of the hippocampus is nonuniformly impacted by age and caloric restriction. Aging Cell. 2016; 15:100–10. https://doi.org/10.1111/acel.12418 [PubMed]
- 80. Souder DC, Anderson RM. An expanding GSK3 network: implications for aging research. Geroscience. 2019; 41:369–82. https://doi.org/10.1007/s11357-019-00085-z [PubMed]
- 81. Li Y, Yu H, Chen C, Li S, Zhang Z, Xu H, Zhu F, Liu J, Spencer PS, Dai Z, Yang X. Proteomic Profile of Mouse Brain Aging Contributions to Mitochondrial Dysfunction, DNA Oxidative Damage, Loss of Neurotrophic Factor, and Synaptic and Ribosomal Proteins. Oxid Med Cell Longev. 2020; 2020:5408452. https://doi.org/10.1155/2020/5408452 [PubMed]
- 82. Drulis-Fajdasz D, Gostomska-Pampuch K, Duda P, Wiśniewski JR, Rakus D. Quantitative Proteomics Reveals Significant Differences between Mouse Brain Formations in Expression of Proteins Involved in Neuronal Plasticity during Aging. Cells. 2021; 10:2021. https://doi.org/10.3390/cells10082021 [PubMed]
- 83. Gostomska-Pampuch K, Drulis-Fajdasz D, Gizak A, Wiśniewski JR, Rakus D. Absolute Proteome Analysis of Hippocampus, Cortex and Cerebellum in Aged and Young Mice Reveals Changes in Energy Metabolism. Int J Mol Sci. 2021; 22:6188. https://doi.org/10.3390/ijms22126188 [PubMed]
- 84. Moraga DM, Nuñez P, Garrido J, Maccioni RB. A tau fragment containing a repetitive sequence induces bundling of actin filaments. J Neurochem. 1993; 61:979–86. https://doi.org/10.1111/j.1471-4159.1993.tb03611.x [PubMed]
- 85. Schneider A, Biernat J, von Bergen M, Mandelkow E, Mandelkow EM. Phosphorylation that detaches tau protein from microtubules (Ser262, Ser214) also protects it against aggregation into Alzheimer paired helical filaments. Biochemistry. 1999; 38:3549–58. https://doi.org/10.1021/bi981874p [PubMed]
- 86. Maas T, Eidenmüller J, Brandt R. Interaction of tau with the neural membrane cortex is regulated by phosphorylation at sites that are modified in paired helical filaments. J Biol Chem. 2000; 275:15733–40. https://doi.org/10.1074/jbc.M000389200 [PubMed]
- 87. Farias GA, Muñoz JP, Garrido J, Maccioni RB. Tubulin, actin, and tau protein interactions and the study of their macromolecular assemblies. J Cell Biochem. 2002; 85:315–24. https://doi.org/10.1002/jcb.10133 [PubMed]
- 88. Mohan R, John A. Microtubule-associated proteins as direct crosslinkers of actin filaments and microtubules. IUBMB Life. 2015; 67:395–403. https://doi.org/10.1002/iub.1384 [PubMed]
- 89. Sallaberry CA, Voss BJ, Majewski J, Biernat J, Mandelkow E, Chi EY, Vander Zanden CM. Tau and Membranes: Interactions That Promote Folding and Condensation. Front Cell Dev Biol. 2021; 9:725241. https://doi.org/10.3389/fcell.2021.725241 [PubMed]
- 90. Bok E, Leem E, Lee BR, Lee JM, Yoo CJ, Lee EM, Kim J. Role of the Lipid Membrane and Membrane Proteins in Tau Pathology. Front Cell Dev Biol. 2021; 9:653815. https://doi.org/10.3389/fcell.2021.653815 [PubMed]
- 91. Steger M, Tonelli F, Ito G, Davies P, Trost M, Vetter M, Wachter S, Lorentzen E, Duddy G, Wilson S, Baptista MA, Fiske BK, Fell MJ, et al. Phosphoproteomics reveals that Parkinson's disease kinase LRRK2 regulates a subset of Rab GTPases. Elife. 2016; 5:e12813. https://doi.org/10.7554/eLife.12813 [PubMed]
- 92. He F, Qi G, Zhang Q, Cai H, Li T, Li M, Zhang Q, Chen J, Ming J, Tian B, Zhang P. Quantitative Phosphoproteomic Analysis in Alpha-Synuclein Transgenic Mice Reveals the Involvement of Aberrant p25/Cdk5 Signaling in Early-stage Parkinson's Disease. Cell Mol Neurobiol. 2020; 40:897–909. https://doi.org/10.1007/s10571-019-00780-7 [PubMed]
- 93. Mees I, Tran H, Roberts A, Lago L, Li S, Roberts BR, Hannan AJ, Renoir T. Quantitative Phosphoproteomics Reveals Extensive Protein Phosphorylation Dysregulation in the Cerebral Cortex of Huntington's Disease Mice Prior to Onset of Symptoms. Mol Neurobiol. 2022; 59:2456–71. https://doi.org/10.1007/s12035-021-02698-y [PubMed]
- 94. Lai YC, Kondapalli C, Lehneck R, Procter JB, Dill BD, Woodroof HI, Gourlay R, Peggie M, Macartney TJ, Corti O, Corvol JC, Campbell DG, Itzen A, et al. Phosphoproteomic screening identifies Rab GTPases as novel downstream targets of PINK1. EMBO J. 2015; 34:2840–61. https://doi.org/10.15252/embj.201591593 [PubMed]
- 95. Yılmaz S, Ayati M, Schlatzer D, Çiçek AE, Chance MR, Koyutürk M. Robust inference of kinase activity using functional networks. Nat Commun. 2021; 12:1177. https://doi.org/10.1038/s41467-021-21211-6 [PubMed]
- 96. Cox J, Neuhauser N, Michalski A, Scheltema RA, Olsen JV, Mann M. Andromeda: a peptide search engine integrated into the MaxQuant environment. J Proteome Res. 2011; 10:1794–805. https://doi.org/10.1021/pr101065j [PubMed]
- 97. Tyanova S, Temu T, Sinitcyn P, Carlson A, Hein MY, Geiger T, Mann M, Cox J. The Perseus computational platform for comprehensive analysis of (prote)omics data. Nat Methods. 2016; 13:731–40. https://doi.org/10.1038/nmeth.3901 [PubMed]
- 98. Nakayasu ES, Gritsenko M, Piehowski PD, Gao Y, Orton DJ, Schepmoes AA, Fillmore TL, Frohnert BI, Rewers M, Krischer JP, Ansong C, Suchy-Dicey AM, Evans-Molina C, et al. Tutorial: best practices and considerations for mass-spectrometry-based protein biomarker discovery and validation. Nat Protoc. 2021; 16:3737–60. https://doi.org/10.1038/s41596-021-00566-6 [PubMed]
- 99. Pascovici D, Handler DC, Wu JX, Haynes PA. Multiple testing corrections in quantitative proteomics: A useful but blunt tool. Proteomics. 2016; 16:2448–53. https://doi.org/10.1002/pmic.201600044 [PubMed]
- 100. Okuda S, Watanabe Y, Moriya Y, Kawano S, Yamamoto T, Matsumoto M, Takami T, Kobayashi D, Araki N, Yoshizawa AC, Tabata T, Sugiyama N, Goto S, Ishihama Y. jPOSTrepo: an international standard data repository for proteomes. Nucleic Acids Res. 2017; 45:D1107–11. https://doi.org/10.1093/nar/gkw1080 [PubMed]
- 101. Zhou Y, Zhou B, Pache L, Chang M, Khodabakhshi AH, Tanaseichuk O, Benner C, Chanda SK. Metascape provides a biologist-oriented resource for the analysis of systems-level datasets. Nat Commun. 2019; 10:1523. https://doi.org/10.1038/s41467-019-09234-6 [PubMed]
- 102. Zhang Y, Chen K, Sloan SA, Bennett ML, Scholze AR, O'Keeffe S, Phatnani HP, Guarnieri P, Caneda C, Ruderisch N, Deng S, Liddelow SA, Zhang C, et al. An RNA-sequencing transcriptome and splicing database of glia, neurons, and vascular cells of the cerebral cortex. J Neurosci. 2014; 34:11929–47. https://doi.org/10.1523/JNEUROSCI.1860-14.2014 [PubMed]
- 103. Sharma K, Schmitt S, Bergner CG, Tyanova S, Kannaiyan N, Manrique-Hoyos N, Kongi K, Cantuti L, Hanisch UK, Philips MA, Rossner MJ, Mann M, Simons M. Cell type- and brain region-resolved mouse brain proteome. Nat Neurosci. 2015; 18:1819–31. https://doi.org/10.1038/nn.4160 [PubMed]
- 104. Ge SX, Jung D, Yao R. ShinyGO: a graphical gene-set enrichment tool for animals and plants. Bioinformatics. 2020; 36:2628–9. https://doi.org/10.1093/bioinformatics/btz931 [PubMed]