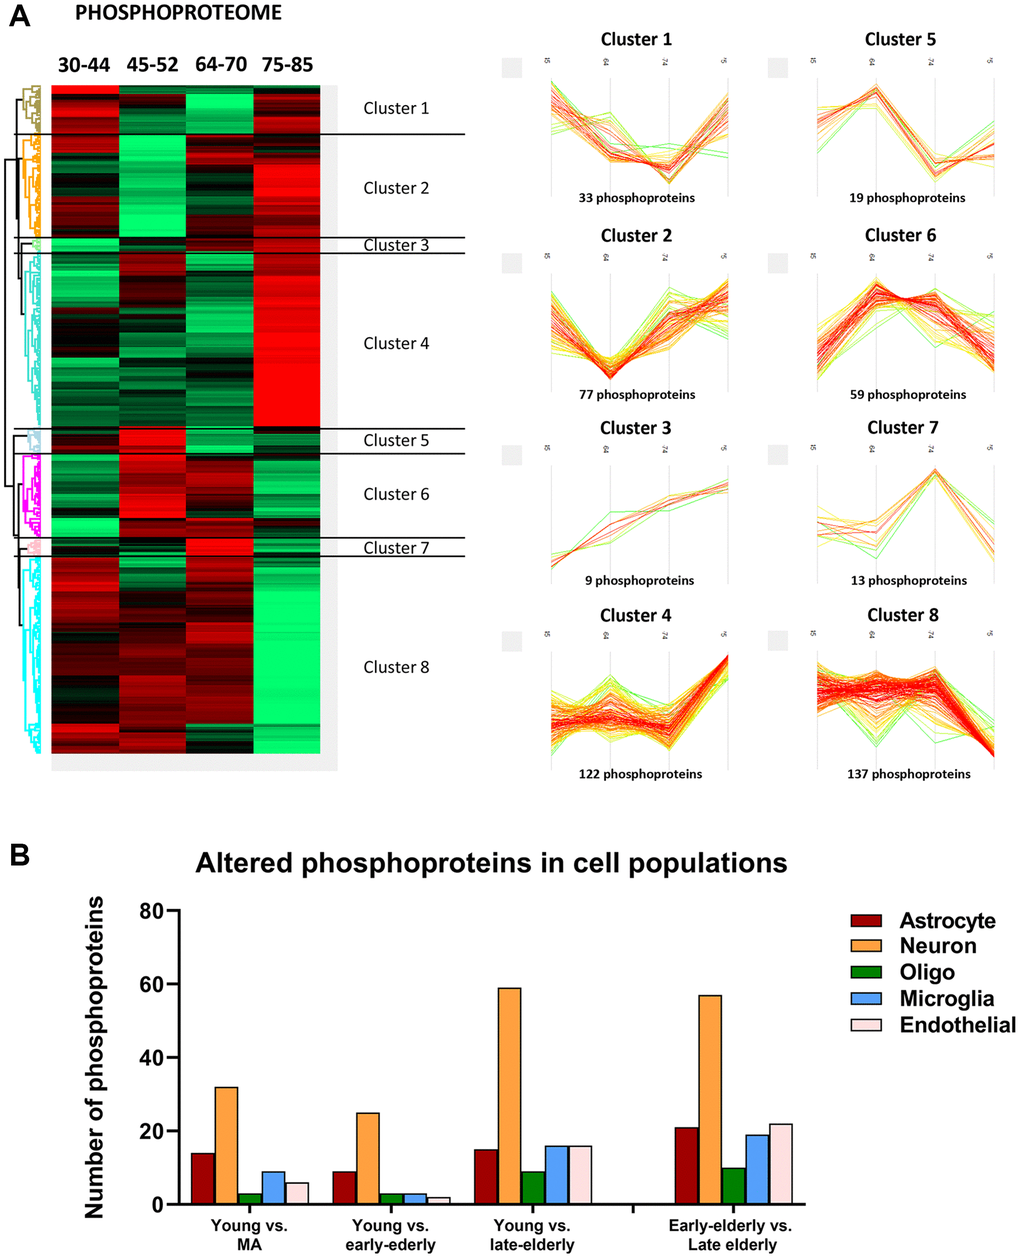
Figure 4.(A) Monitoring of differentially expressed phosphoproteins across age. (Left) Heatmap representing the differential expressed phosphorylated proteins across the four age groups: group 1 (young): 30–44y; group 2 (middle-aged: MA): 45–52y; group 3 (early-elderly): 64–70y; and group 4 (late-elderly): 75–85y. As indicated in Figure 2, each line corresponds to a phosphoprotein in which the Z-score (a measurement in terms of standard deviations from the mean) is evaluated. Positive and negative Z-scoring is represented in red and green respectively. (Right) Profile-plots representing phosphoprotein clusters with similar expression trajectories across age. Cluster 4 and cluster 8 indicate protein subsets that are specifically modulated in the late-elderly group. (B) The graphical representation illustrates the cellular type assignment of phosphoproteins based on available RNA-seq databases. The major changes are observed in proteins associated with neurons.