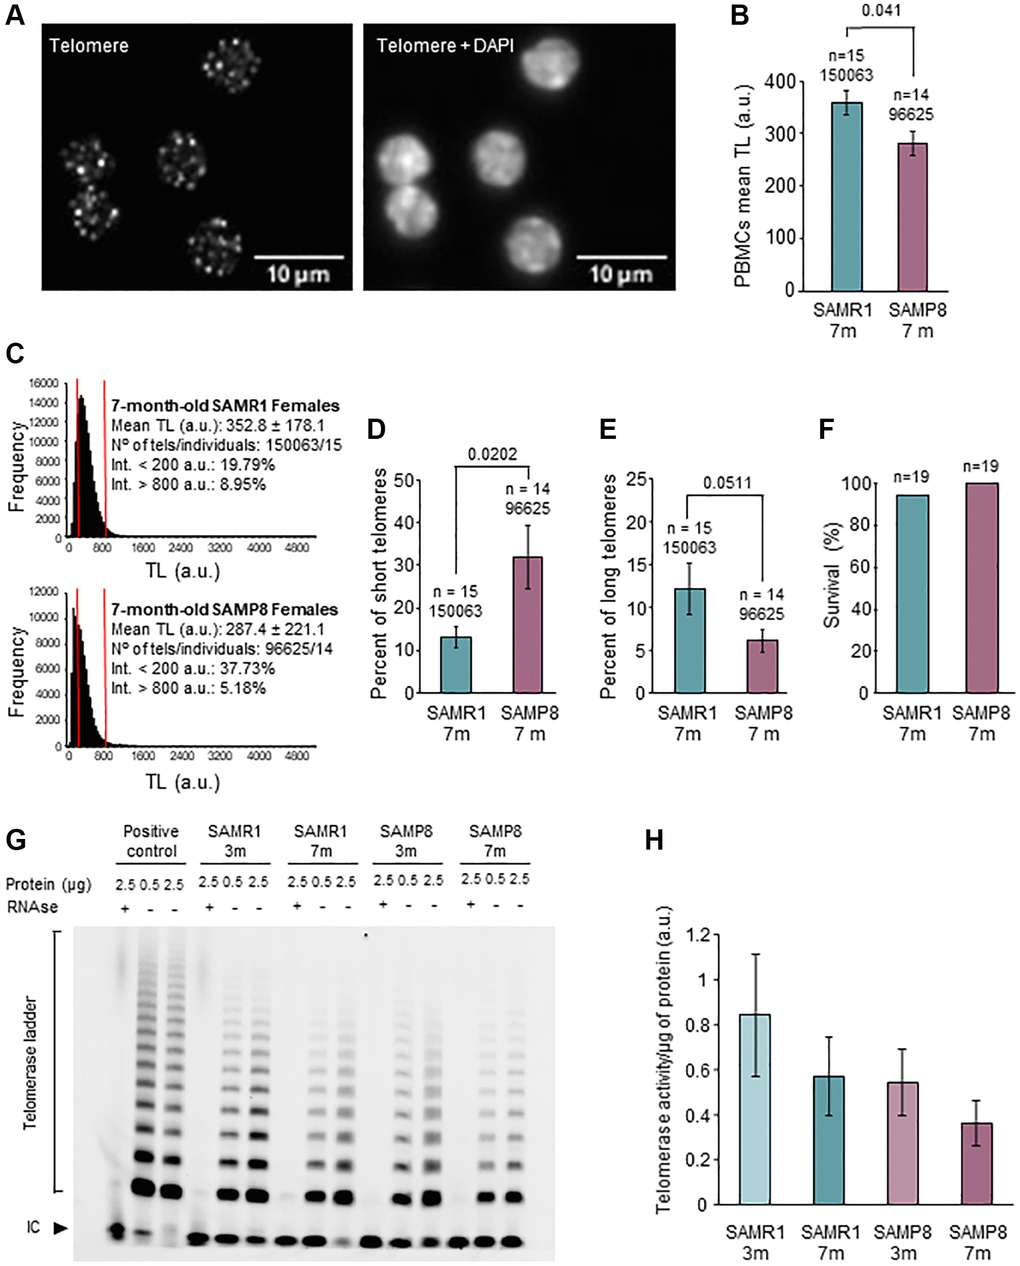
Figure 2.Analysis of telomere length in PBMCs and telomerase activity in ovary. (A) The micrographs show representative images of telomere HT-qFISH (white dots, left panel) and the merge (DAPI and telomeres, right panel) on PBMCs. (B) Mean TL of PBMCs, analyzed by HT-qFISH, in 7-month-old SAMP8 and SAMR1 females. (C) Telomere-length frequency histograms in 7-month-old controls (top panel) and age-matched SAMP8 females (lower panel). (D) Percent of short telomeres in PBMCs of 7-month-old SAMP8 and SAMR1 females. (E) Percent of long telomeres in PBMCs of 7-month-old SAMP8 and SAMR1 females. (F) The graph shows the percent of survival at 7 months of age in SAMP8 females and controls. (G) The micrograph shows telomerase activity assay from ovarian extracts of SAMP8 and SAMR1 females at 3 and 7 months of age. Two protein concentrations (0.5 and 2.5 μg) of the same ovarian extract from each mouse are shown. (H) Quantification of the telomerase activity TRAP assay shown in G. n indicates the number of mice analyzed. Underneath, the number of telomere spots analyzed is indicated. The S.E.M. is represented in error bars (B, D, E and H). Statistical significance was determined Mann-Whitney U test (B, D and E) and Fisher’s exact test (F). Abbreviation: IC: Internal Control. Scale bars are 10 μm.