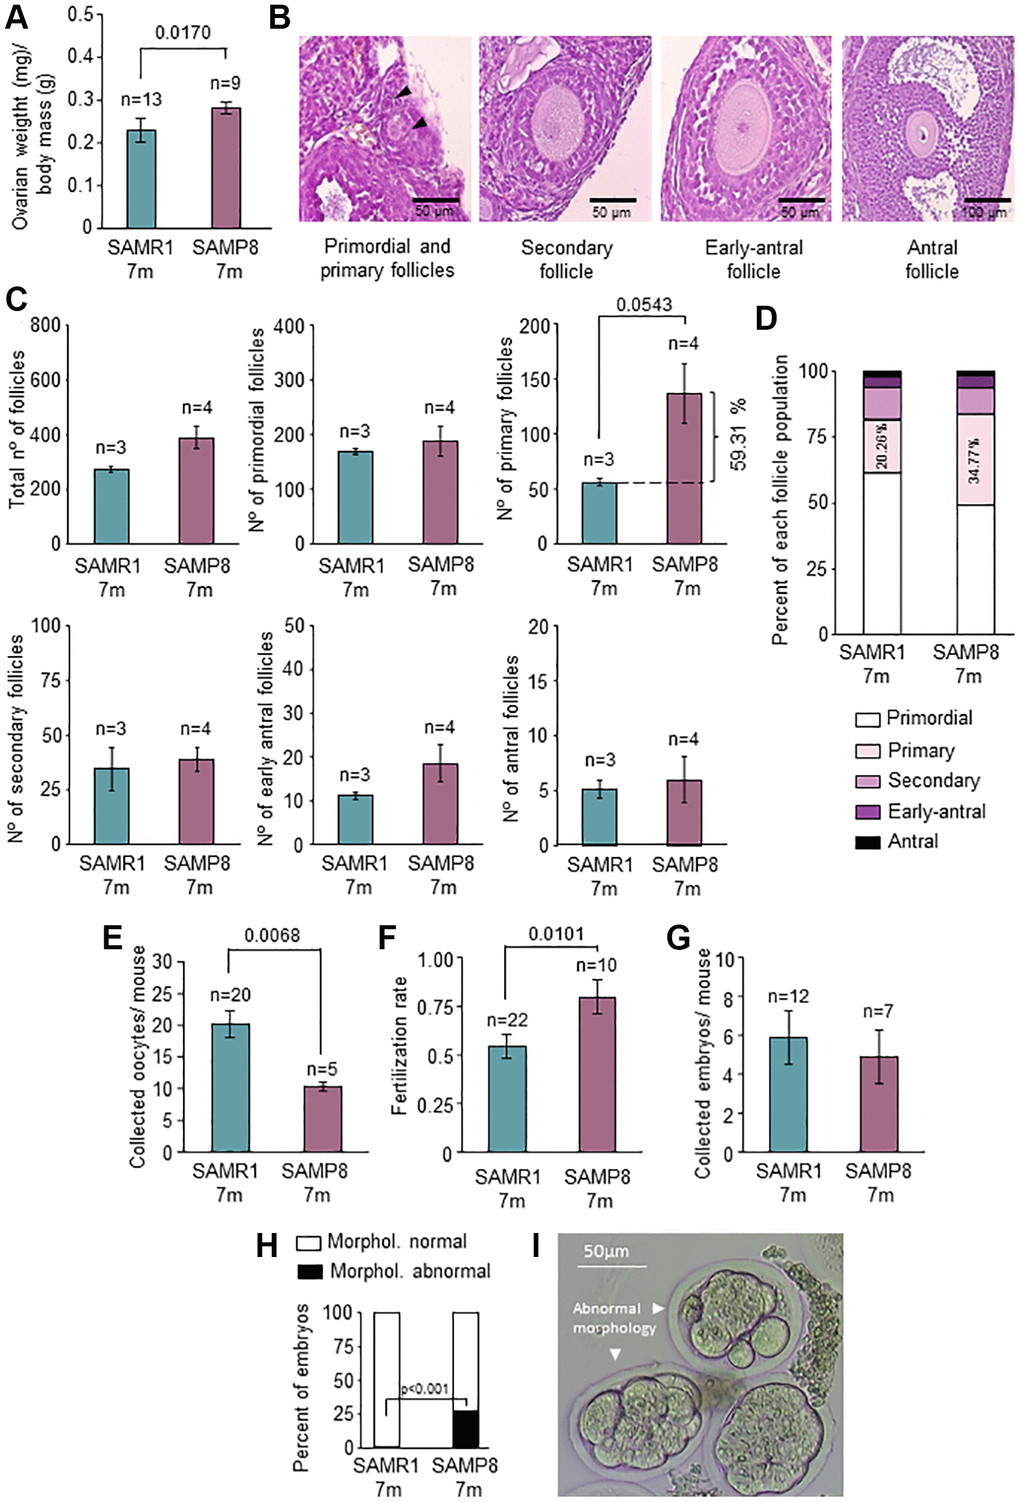
Figure 4.Characterization of ovarian function and fertility. (A) The graph shows the ratio of ovarian weight normalized to total body mass in 7-month-old SAMP8 and SAMR1 females. (B) Representative images of primordial, primary, secondary, early-antral, and antral follicles in H&E-stained ovarian sections. (C) Follicle count in H&E-stained ovarian sections in the mice described in A. The total number of follicles (left top panel), primordial (middle top panel), primary (right top panel), secondary (left lower panel), early-antral (middle lower panel) and antral follicles (right lower panel) are represented. (D) The graph shows follicle types in percentages in mice described in A. The percentages of primary follicles are indicated inside the corresponding box. (E) Mean number of collected oocytes after OS in mice described in A. (F) Fertilization rate in mice described in A. (G) Mean number of collected embryos after ovarian stimulation in mice described in A. (H) Percent of morphologically normal and abnormal embryos in mice described in A. (I) Representative images of preimplantation embryos (morphologically abnormal embryos are indicated with arrows). n indicates the number of mice analyzed. The S.E.M. is represented in error bars (A, C, E, F and G). Statistical significance was determined by Mann-Whitney U test (A, C, E and F) and unpaired t-test (G). Fisher’s exact test was used to determine p-values (H). Scale bars are 50 μm (B, left and middle panel) and 100 μm (B, right panel).