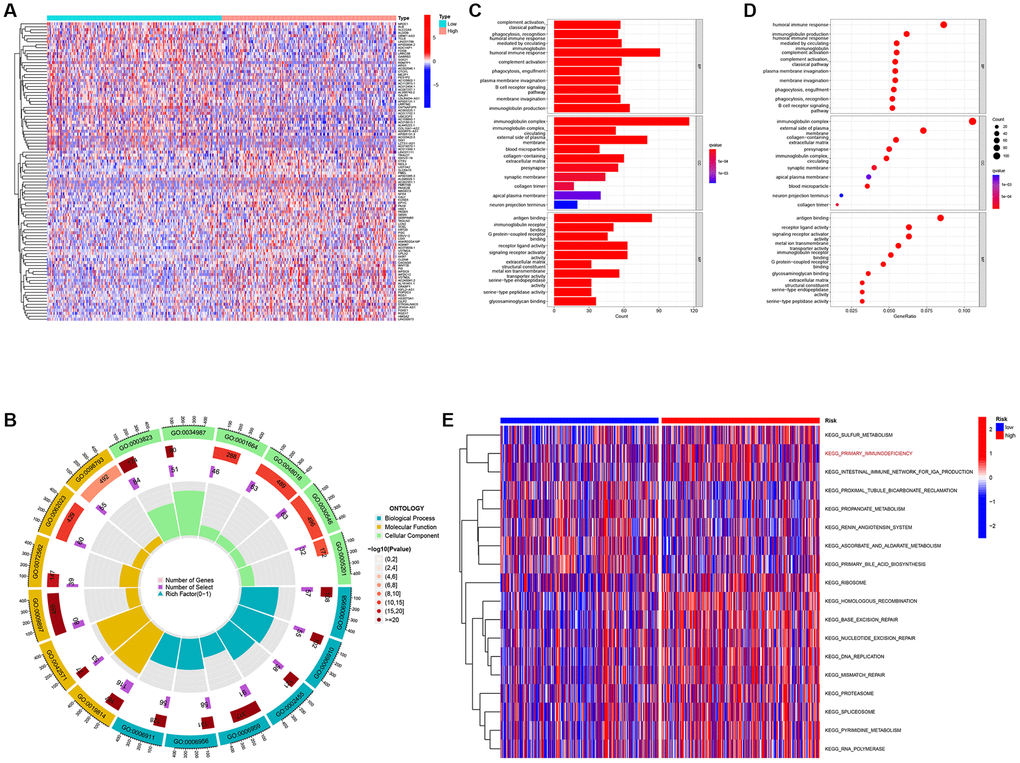
Figure 3.Differentially expressed genes analysis and gene function enrichment analyses. (A) Heat map showing the DEGs between the high-risk and low-risk groups. (B) Circle plot through Gene Ontology (GO) analysis visualizing the biological processes enriched by DEGs. (C, D) Bubble diagram and bar plot showing the signaling pathways enriched by DEGs through GO analysis. (E) Heatmap illustrating the result of GSVA.