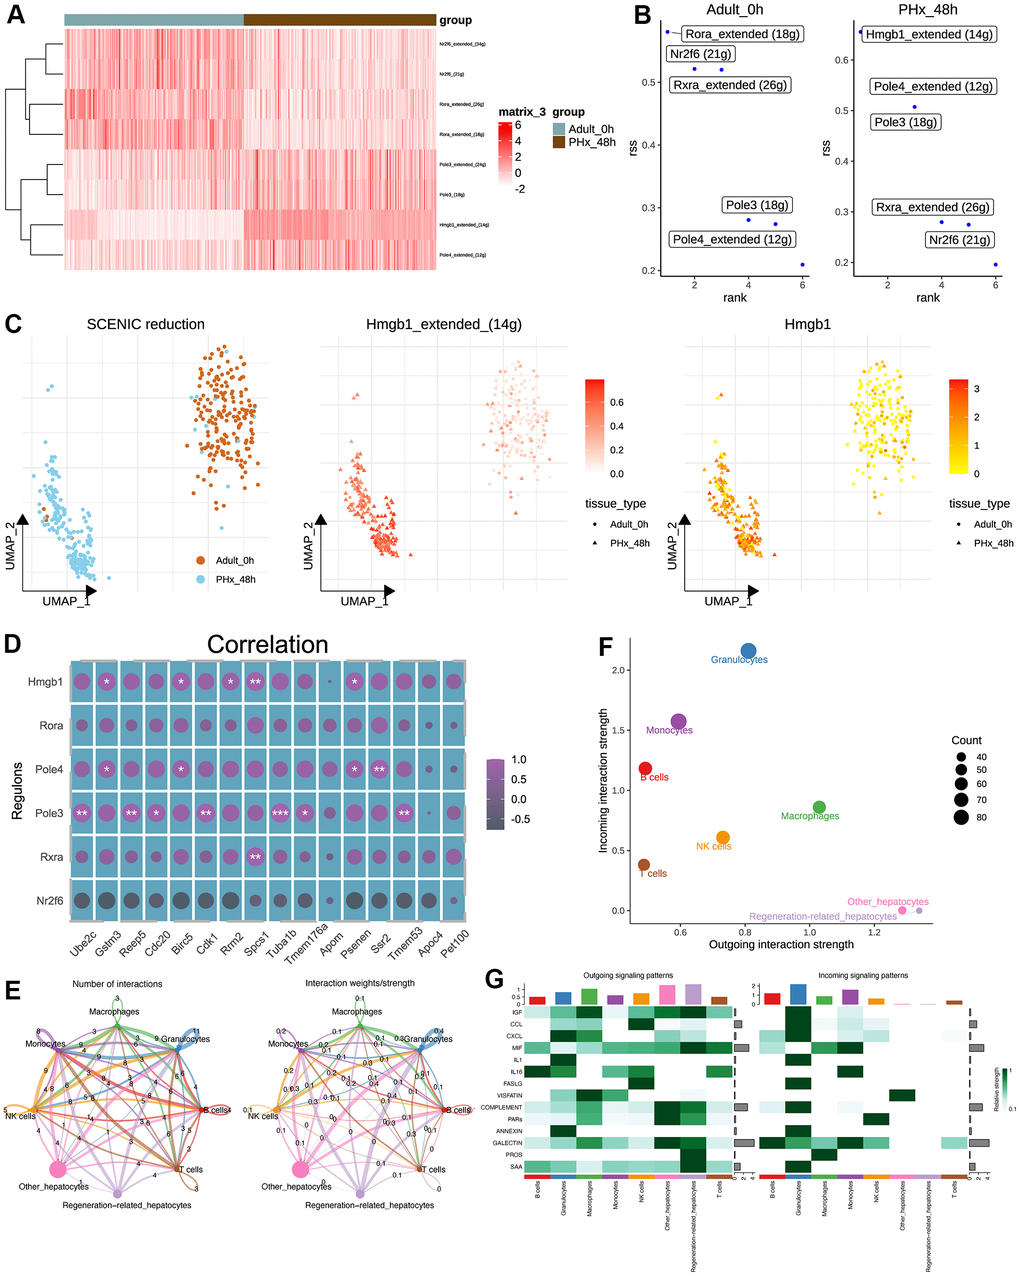
Figure 5.Transcriptional regulatory network and cell-cell communication analyses of hepatocytes. (A) Heatmap shows the differences of TFs in hepatocytes between the PHx 0h and PHx 48h groups. Only 400 hepatocytes were randomly chosen for SCENIC analysis. (B) Top activities of TFs between different groups of hepatocytes. RSS indicates Regulon Specificity Score. (C) Activity distribution of Hmgb1 and expression distribution of Hmgb1 in hepatocytes. (D) Correlation analysis of SCENIC-identified regulons and 17 machine-learning-identified feature genes in bulk RNA-seq of PHx samples. (E) Cellchat analysis of all cell types. Both interaction numbers and interaction strengths were showed. (F) Scatter plot indicates the differences of incoming and outgoing interaction strengths among all cell types. (G) Top cell cytokines were showed in heatmap across all cell types in PHx.