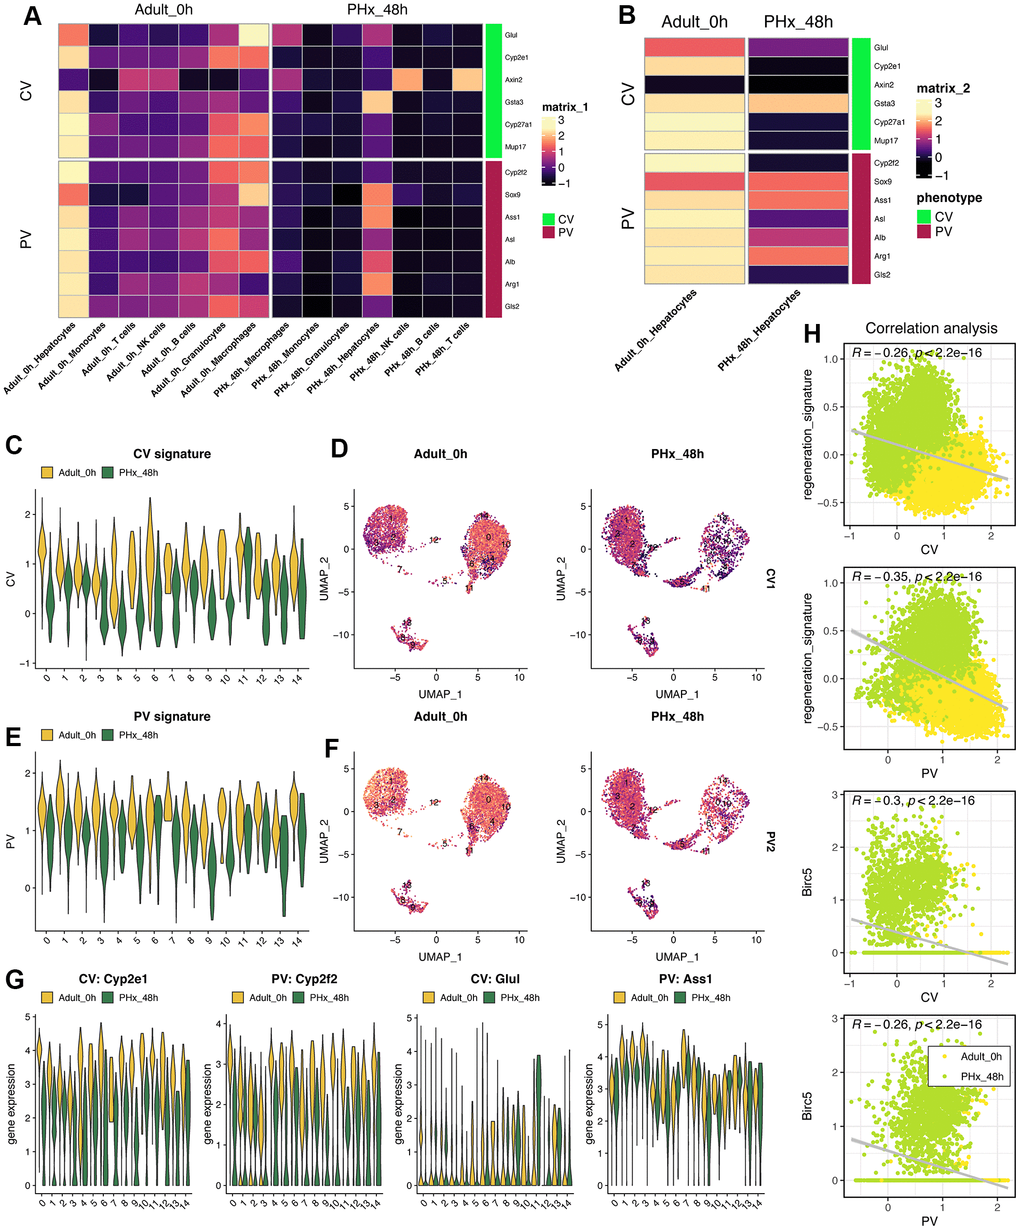
Figure 8.Characteristics of liver zonation in mice after PHx. (A) Expression levels of liver zonation genes across all cell types at PHx 0h and PHx 48h groups. PV: periportal vein area; CV: pericentral vein area. (B) Expression levels of liver zonation genes in hepatocytes with the comparison between the PHx 0h group and the PHx 48h group. (C) Violin plot shows the CV signature score in all 15 hepatocytes clusters. (D) Distribution of the CV signature score in all 15 hepatocytes clusters. The CV signature score was calculated using “addmodule” function in seurat package. (E) Violin plot shows the PV signature score in all 15 hepatocytes clusters. (F) Distribution of the PV signature score in all 15 hepatocytes clusters. The PV signature score was calculated using “addmodule” function in seurat package. (G) Expression levels of Cyp2e1, Cyp2f2, Glul and Ass1, which were typical biomarkers of PV or CV, in all hepatocyte clusters. Yellow indicates the PHx 0h group while Green indicates the PHx 48h group. (H) Correlation analyses among regeneration signature, CV signature, PV signature and Birc5 gene in all single hepatocyte cells from both PHx 0h and 48h groups.