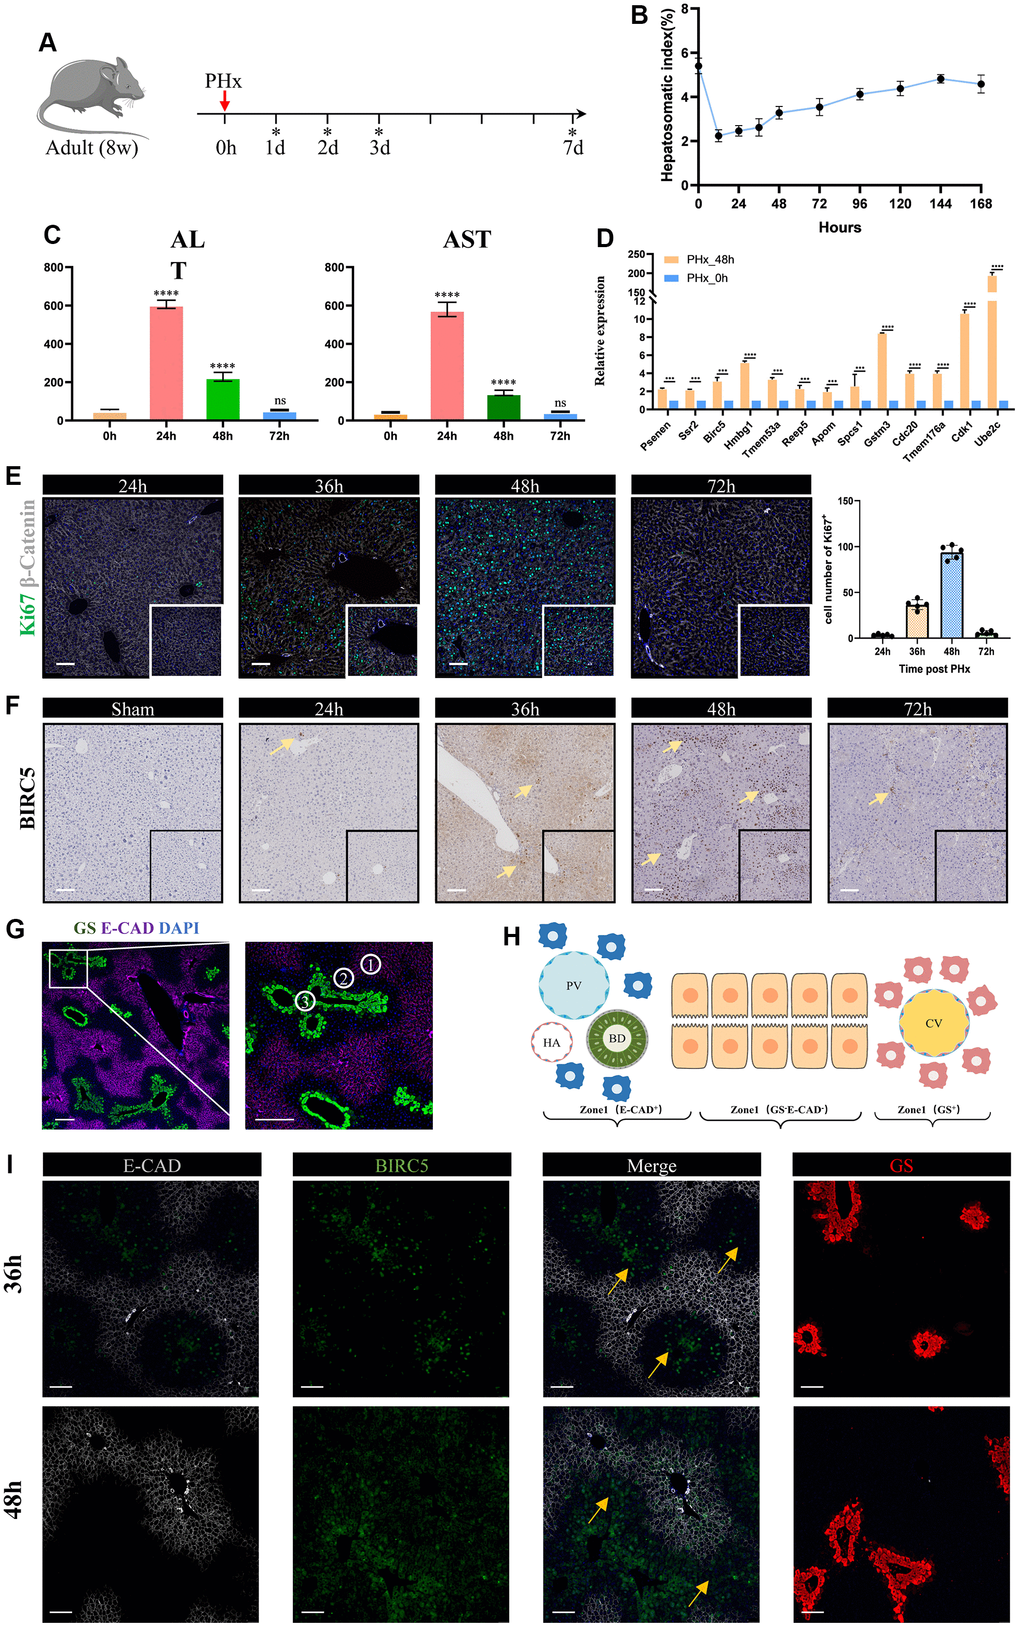
Figure 9.Validation of liver regeneration-related signature post PHx. (A) A schematic of experimental design procedure: Mice underwent surgical resection. Ticks show the time point when mice were sacrificed. Liver tissues are harvested at 24h, 36h, 48h, 72h and 7days. (B) Time curve showed the liver-to-body weight of remanent liver after PHx. Data are mean±sd, ****p<0.0001, ns: no significant, (n=3 mice per groups). (C) The levels of serum indicate that liver mass return to normal function after 3days post PHx. (D) Relative expression levels of liver regeneration-related genes in hepatocytes between the PHx 0h group and the PHx 48h group. Data are “mean±sd”, ***p<0.001, ****p<0.0001. (E) Representative immunofluorescence shows multiplication capacity of hepatocytes at different time point post PHx, Ki67 (green), β-catenin (gray), DAPI (blue), Scale bar=100μm. Graphical representation indicates that the 36–48-hour time period represents an active mitotic phase. (F) We performed immunohistochemical imaging to evaluate the expression of Birc5 in both post-PHx and Sham livers. The significantly expressed hepatocytes were indicated by yellow arrows, scale bar=100μm. (G) Co-staining of zonal specific markers during homeostasis. Glul, which encodes glutamine synthetase (GS), was exclusively expressed in pericentral hepatocytes, while Cdh1, which encodes E-cadherin, was expressed only in periportal hepatocytes. (H) schematic of liver zonation. (I) Spatial distribution of Bircs5 following PHx at 36h and 48h revealed that liver regeneration-related hepatocytes primarily initiated in zone 2 before proceeding to other regions.