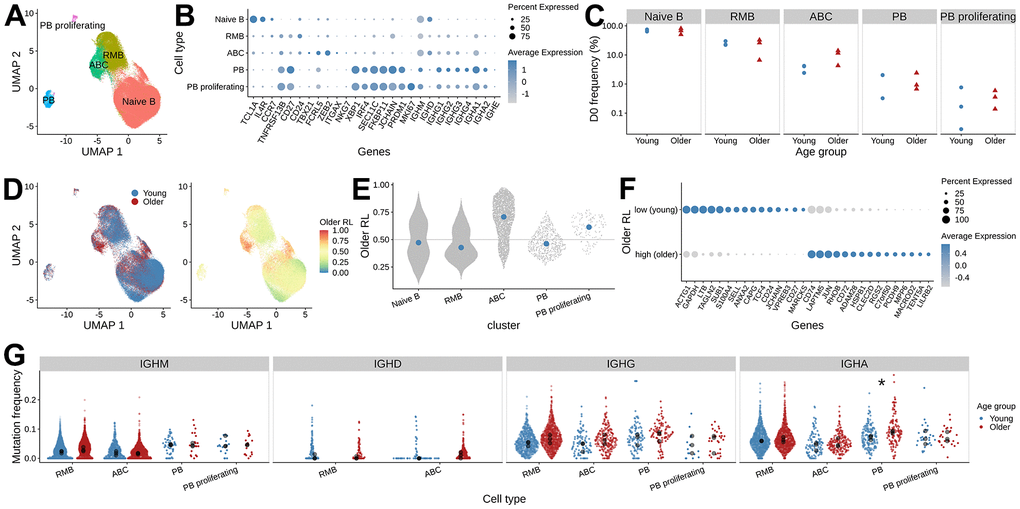
Figure 2.Differences in B cell gene expression between young and older adults prior to vaccination. (A) UMAP visualization of single-cell RNAseq data, colored by B cell subset assignment (RMB: resting memory B cells, ABC: activated B cells, PB: plasmablast). (B) Expression of the marker genes used for B cell subset assignment. Dot plot showing average log-normalized expression of B cell subset marker genes and the fraction of cells expressing the genes in each B cell cluster. (C) The frequency of B cell subsets at pre-vaccination. The x-axis, along with shape and color of the dots, indicates the age group, and the y-axis represents the frequency of B cell subsets in each sample. (D) Pre-vaccination (D0) differential abundance analysis of B cells between young and older adults. The left panel is colored by the age group label. The right panel is colored by the MELD score that indicates older adults-associated relative likelihood; the higher the value, the more likely that the cells with the given gene expression profile are from the older subject samples. (E) MELD score distribution for the B cell subsets. (F) Differentially expressed genes between ABCs with high and low MELD score, were selected from gene set enrichment analysis using enrichR. (G) Mutation frequency distribution of the heavy chain V segments. The mean SHM frequency of each subject is indicated as black dots for each isotype and B cell subset, colored by age group. Wilcoxon rank-sum test was performed to test for the difference in mean mutation frequency between age groups (*: adjusted p-values < 0.05).