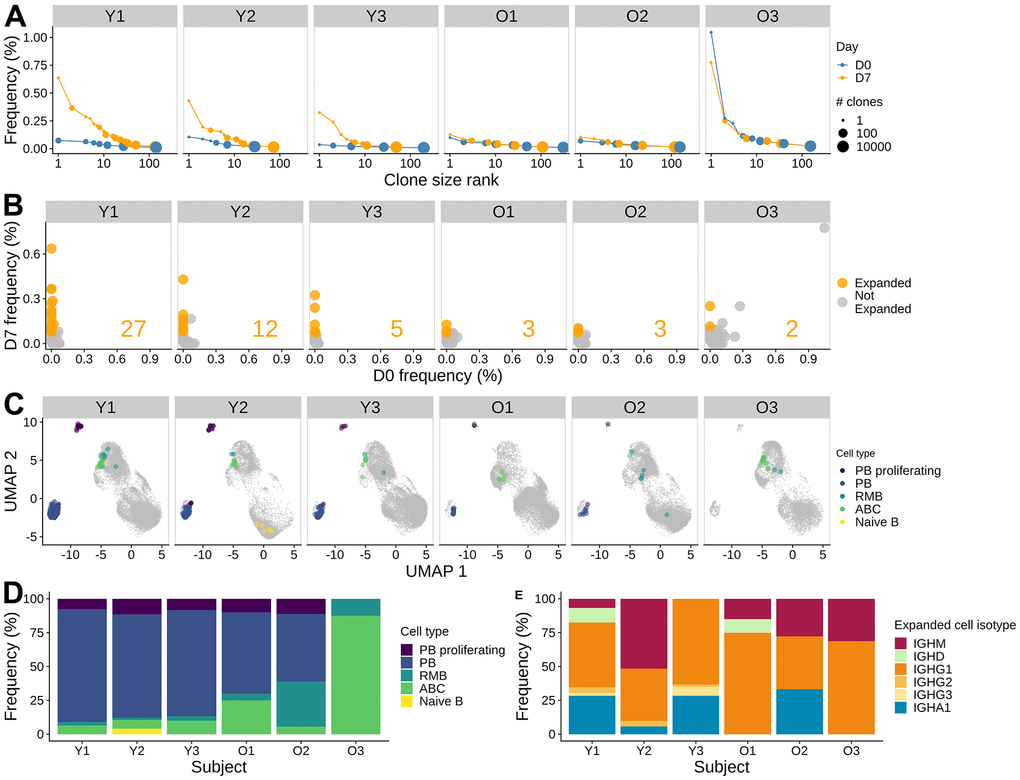
Figure 3.Influenza vaccine induces more clonal expansion in young adults, and the induced clones are more skewed towards memory in older adults. (A) B cell clone size distribution. The size of the dots indicates the number of clones. The x-axis indicates the rank of the clone size, with the rank of 1 being the largest. The y-axis indicates the relative abundance of the clone within the sample. The color indicates the time points. (B) Significantly expanded clones at day 7 post-vaccination. The frequencies of individual clones pre-vaccination and at day 7 post-vaccination were visualized by scatter plot. Fisher's exact test was used to identify significantly expanded clones, highlighted in orange. The number of significantly expanded clones was annotated in the plot for each subject. (C) Significantly expanded clones visualized on a UMAP, highlighted with color indicating the cell type. (D) The cell subset composition of the expanded clones at day 7. (E) Isotype composition of the expanded clones for day 7 samples.