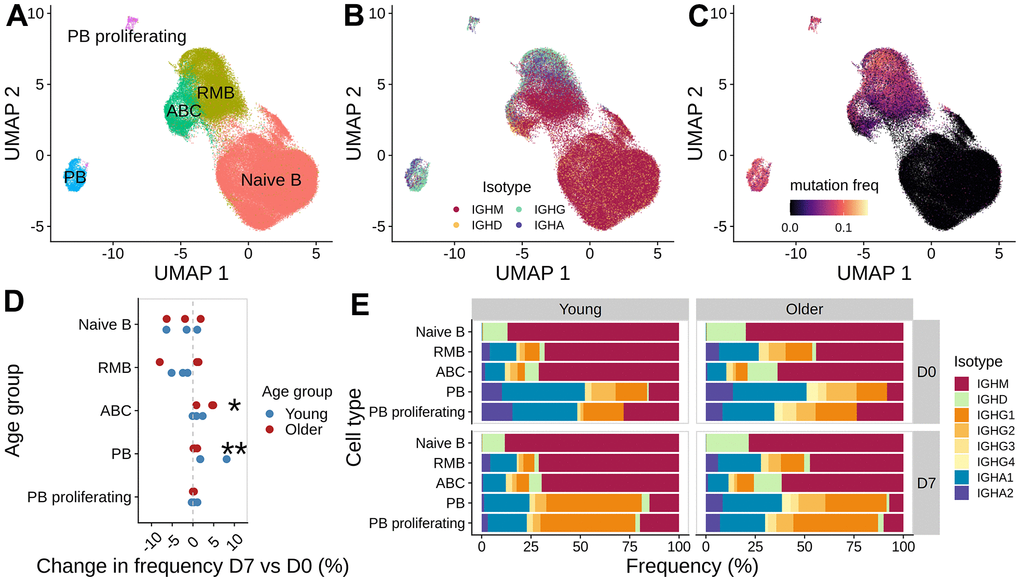
Figure 4.Analysis of B cell subpopulations before and after vaccination. UMAP of gene expression data colored with (A) B cell subset labels, (B) isotype information from the V(D)J sequences, and (C) mutation frequency in the V segment of heavy chain BCRs. (D) Difference in the frequency of B cell subset between day 7 and day 0 for each subject, colored by age group (*: p < 0.1, **: p < 0.05). (E) Isotype composition for each cell subset, separated by age group and time point.