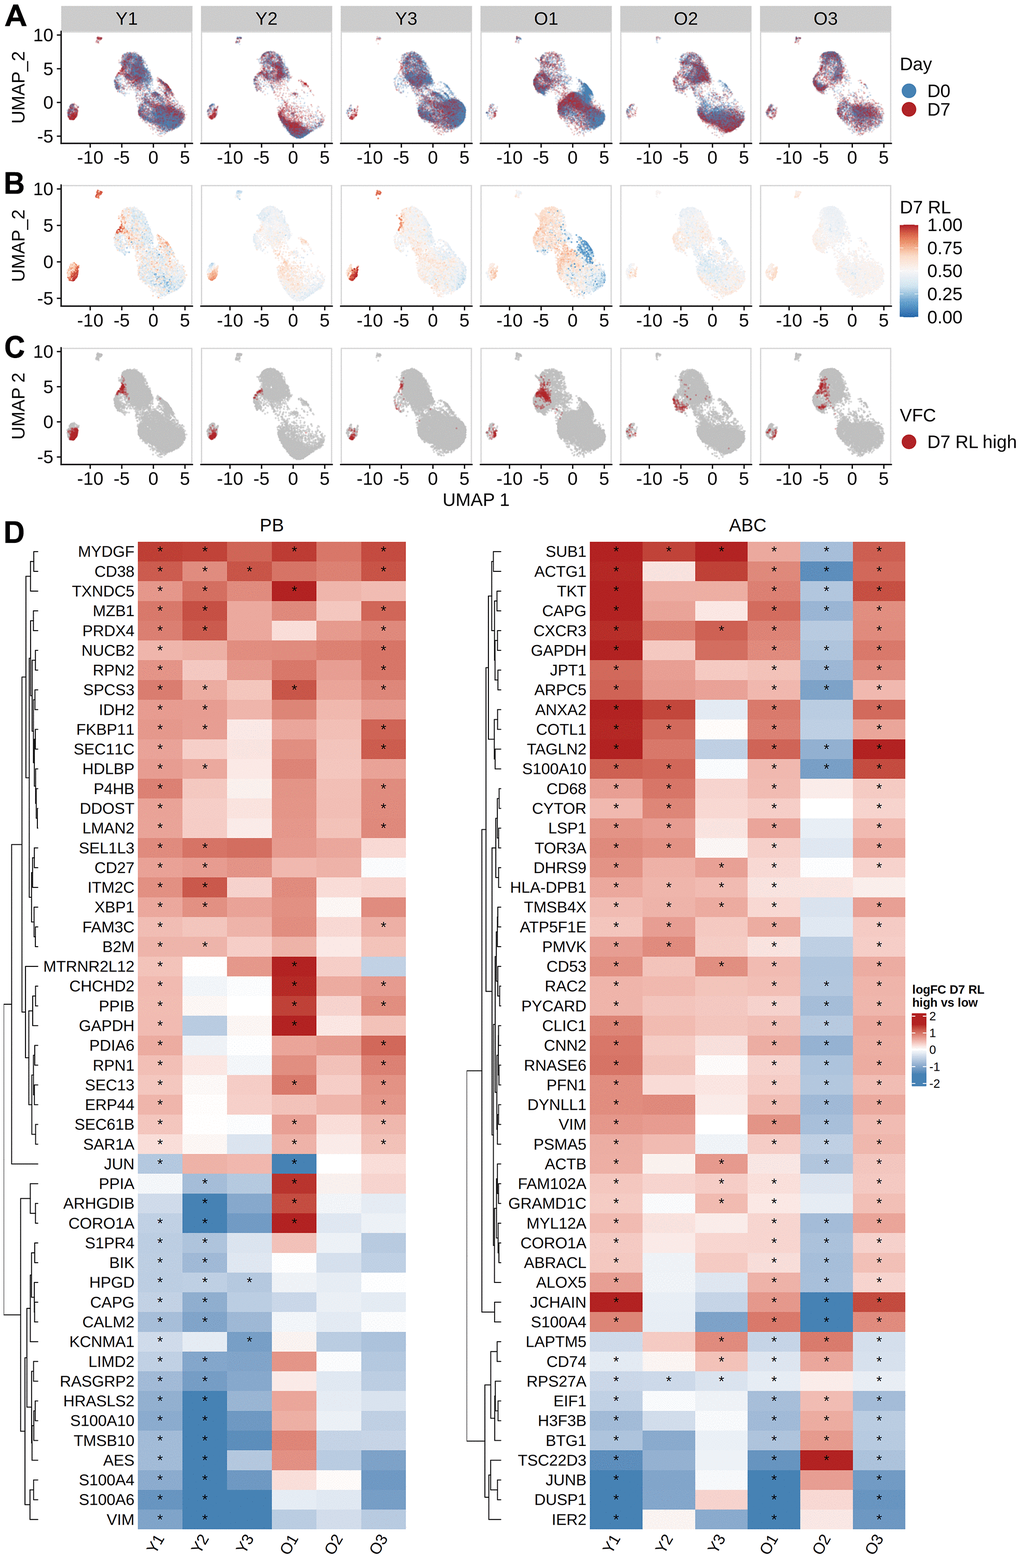
Figure 5.Identifying vaccine-responsive subpopulations within plasmablasts and activated B cells. MELD differential abundance analysis to find cell subpopulations changing abundance between day 0 and day 7. UMAP of gene expression data colored by (A) the day label of the cells, (B) signal filtered by MELD, and (C) the vertex frequency clustering to find subclusters of PB and ABC with differential abundance between day 0 and day 7. (D) Top 50 differentially expressed genes based on average absolute log FC between day 0 and day 7 were shown for each subject. Wilcoxon rank-sum test was used to select differentially expressed genes by comparing high MELD score (day 7-like) and low MELD score (day 0-like) clusters for each subject (FDR-adjusted p-value < 0.05). Genes that significantly differ between high and low MELD score clusters, and have an average absolute log-2 fold change greater than 0.3 in at least one subject, were selected for heatmap visualization. The color in the heat map indicates the log-2 fold change of count values between high and low MELD score clusters. Asterisks indicate an FDR-adjusted p-value smaller than 0.05.