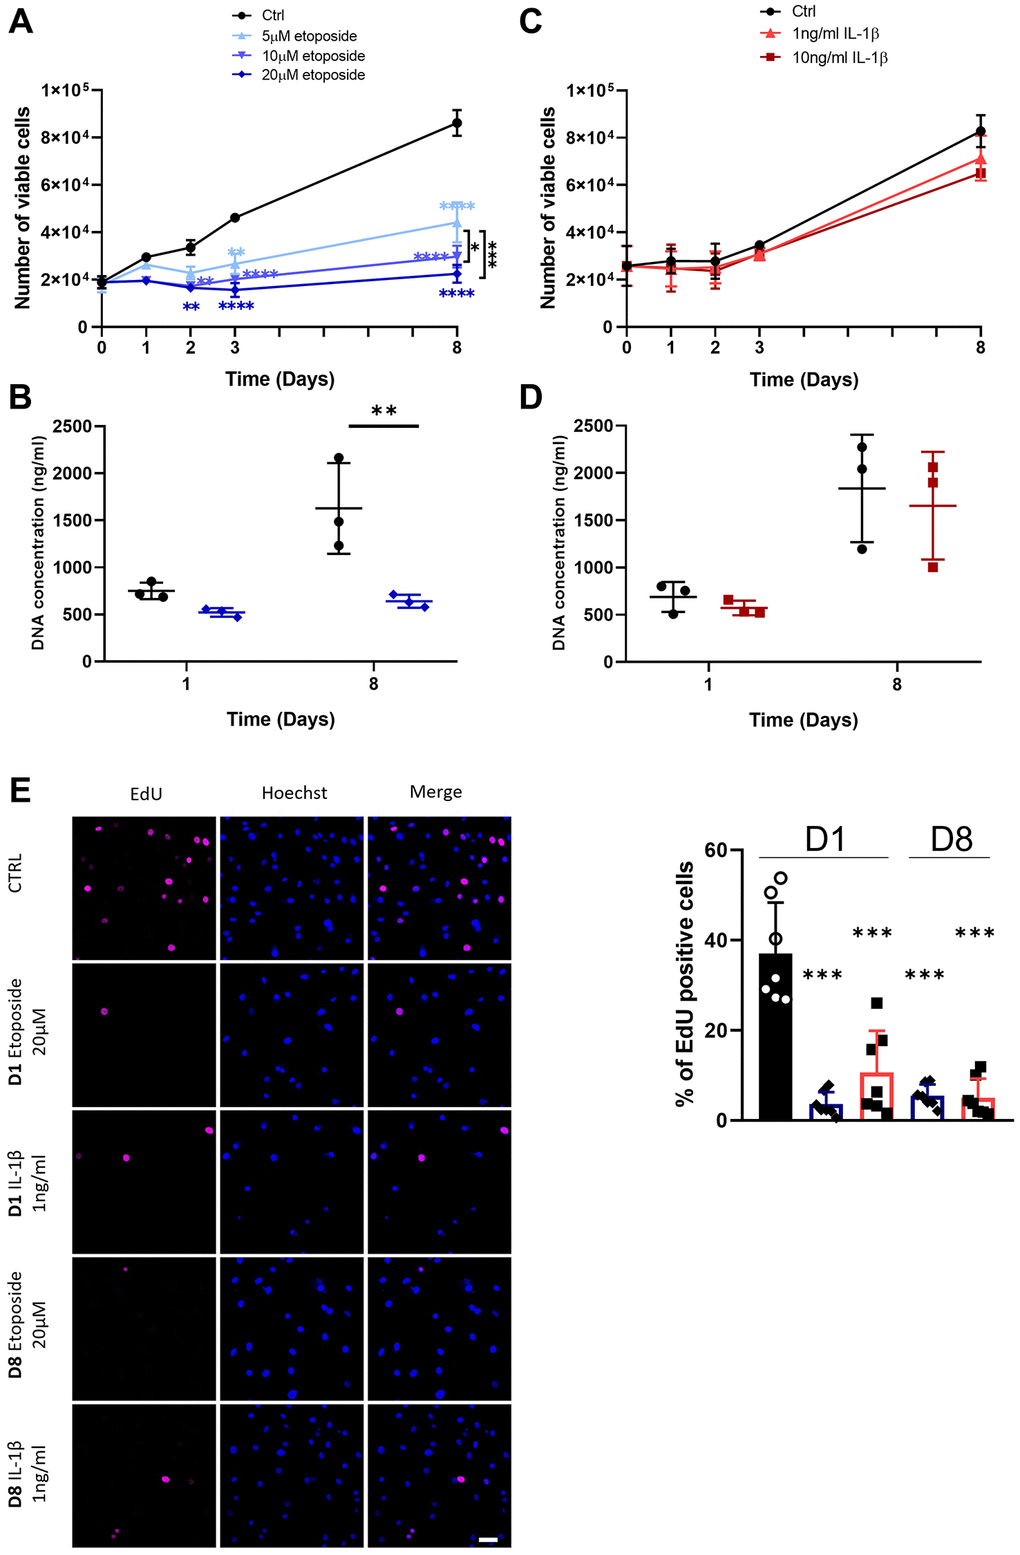
Figure 2.Impact of Etoposide and IL-1β treatments on HACs proliferation. HACs were treated with etoposide (blue) at 5, 10 or 20 μM (A, B) for 24 h and then cultured in normal media or with IL-1β (red) at 1 and 10 ng/mL (C, D) for the length of the experiment. (A, C) The number of viable cells was assessed by trypan blue exclusion dye. (B, D) DNA quantification in Etoposide and IL-1β treated HACs at day 1 and day 8. Data are shown as mean ± SD, (n = 3). P-values were calculated by the two-way ANOVA test, *p ≤ 0.05; **p < 0.01; ***p < 0.001; ****p < 0.0001. (E) EdU was used to identify proliferative cells and Hoechst staining to visualize the nucleus at day 1 and 8 (scale bar = 50 μm). The images were analyzed by quantification of positive cells for EdU normalized versus the total number of cells obtained with the Hoechst staining at each time. Data are shown as mean ± SD, (n ≥ 3). P-values were calculated by Mann-Whitney test compared to the control on day 1, ***p < 0.001.