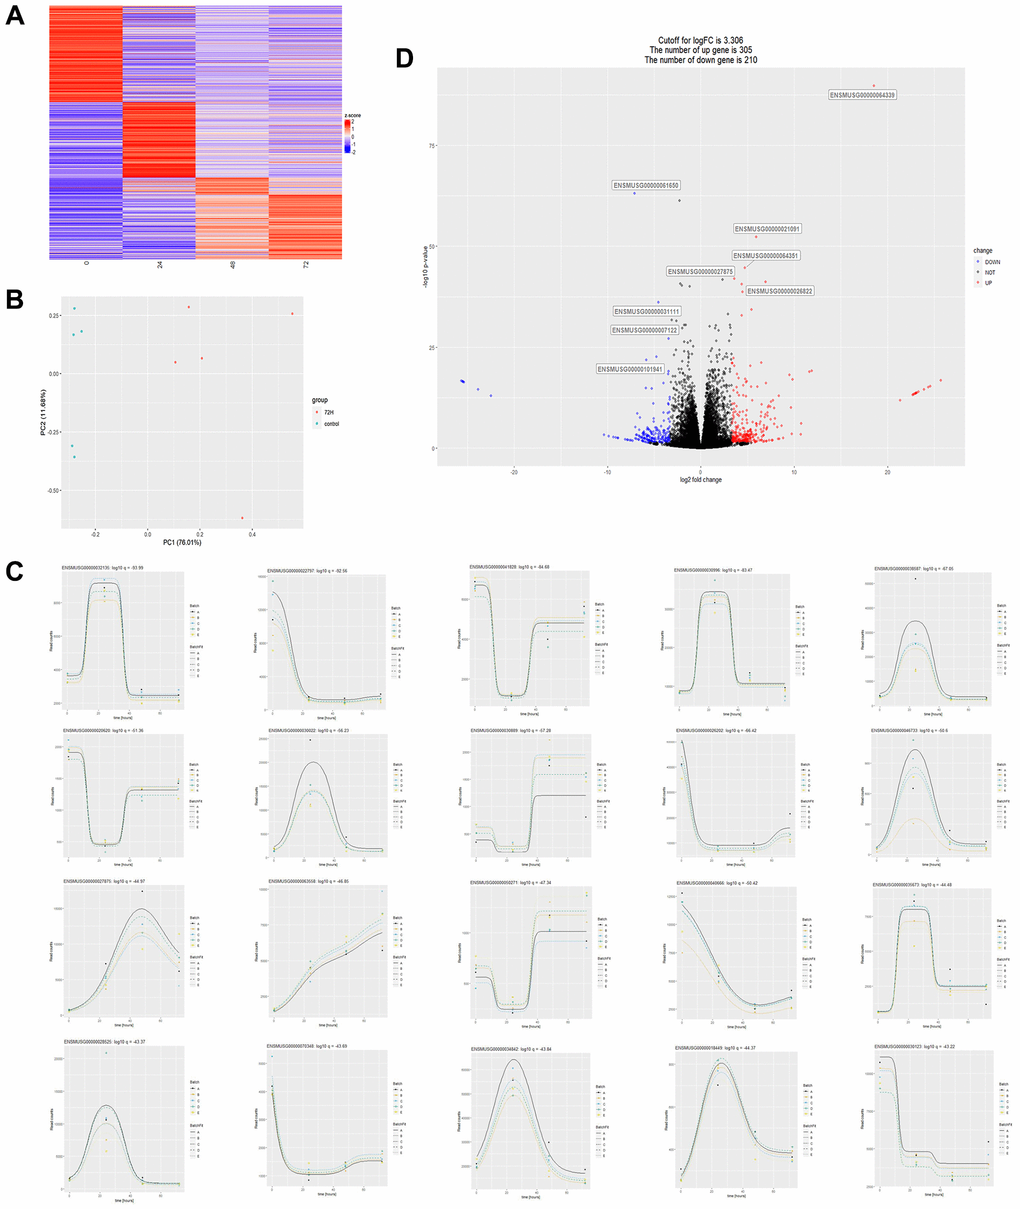
Figure 1.Transcriptome data analysis of cardiac tissues from CLP mice at different times. (A) Heatmap of the overall change of a gene over time, where the abscissa represents time, the vertical axis represents the amount of relative change of a gene, and the redder the color represents the more up-regulated fold of a gene, the more downregulated fold. (B) Principal component analysis plot (PCA) of two sets of sample data at 72 and 0 hours after CLP in the dataset. (C) The statistical plot of the top 20 differential genes over time, with the abscissa representing time and the ordinate representing the amount of expression of a single gene. (D) Differential gene volcano plot between 72H and control: 305 differentially expressed genes were up-regulated, and 210 differentially expressed genes were down-regulated with a logFC (relative expression of genes) cut-off value of 3.306, P < 0.05.