


Introduction
The life-threatening condition of sepsis, a result of an abnormal immune reaction to infection, can cause organ dysfunction [1]. Cardiac dysfunction, a complication of sepsis, is a common occurrence, with around 60% of septic patients being diagnosed within the initial 3 days [2]. This complication is multifaceted, involving inflammatory reactions, oxidative stress damage, mitochondrial dysfunction, and apoptosis [3, 4]. Targeting regulation of macrophage polarization may be a beneficial way to restore the host immune balance, thus offering a novel therapeutic approach for sepsis treatment. Numerous experiments have demonstrated that cardiac dysfunction is connected to changes in cardiac substrate and energy metabolism. Ketone bodies have been observed to provoke oxidative stress and upregulate several signaling pathways linked to diabetic issues [5]. The metabolic and bioenergetic pathways point to ketone body metabolism as a significant factor in the myopathic heart [6]. Mitochondrial 3-hydroxy-3-methylglutaryl-CoA synthase 2 (Hmgcs2), part of the HMG CoA family of proteins, is the enzyme responsible for the rate-limiting reaction of ketogenesis [7]. This process takes place mainly in the liver mitochondrial matrix, with a rate that is proportional to total fat oxidation. Transported through the mitochondrial membrane via the acyl chain and β-oxidation, the mitochondrial isoform of Hmgcs2 catalyzes the condensation of acetoacetyl-COA (AcAc-COA) and acetyl-CoA (acetyl-CoA), resulting in the production of HMG CoA. HMGCL then cleaves HMG CoA, releasing acetyl-CoA and acetoacetate (AcAc), which is then taken up by phosphatidylcholine-dependent mitochondrial d-β OHB dehydrogenase (BDH1) and reduced to d-β-Hydroxybutyrate (d-βOHB) [7]. The regulation of Hmgcs2 expression and activity during early postnatal life, aging, diabetes, starvation, and the ingestion of a ketogenic diet [8] is still not fully understood, and its physiological status is still being explored.
The immune system’s dysfunction is the foundation of sepsis, a systemic inflammatory response syndrome brought on by infection. Macrophages, a key component of the innate immune system, are highly diverse and can be programmed to act in certain ways. The process of macrophage polarization involves a complex regulatory network, which is influenced by multiple signaling molecules, transcription factors, epigenetic modifications, and metabolic reprogramming [9]. M1-like macrophages release many pro-inflammatory mediators, whereas M2-like macrophages release many anti-inflammatory mediators. The disparity between M1-like and M2-like macrophages sparks the commencement and growth of sepsis [10–14]. Therefore, targeted regulation of the macrophage polarization process may be a useful approach to normalizing the host immune balance, providing a new therapeutic modality for the treatment of sepsis.
Materials and Methods
Animals experiment
The sepsis model was induced via the CLP method. A selection of 24 male mice, each with an age of 6 weeks and a weight ranging from 22-25 g, was made using the Ethical Lot Number CMU2021201. All mice were randomly divided into (1) Sham group (n = 6): Equal dose control buffer was injected intraperitoneally every two weeks, and PBS (0.01 mol/L, pH7.4) was used as a control buffer; (2) Sham+ ASO group (n = 6): Mouse Hmgcs2 targeted antisense oligonucleotide (ASO, ISIS 191229;5′-CTGTTTGTCACTGTGGATG) was injected intraperitoneally every two weeks (25 mg/kg);(3) CLP group (n = 6): The same dose of PBS was injected intraperitoneally every two weeks;(4) CLP+ASO (n = 6): Mouse ASO (25 mg/kg) was injected intraperitoneally every two weeks. CLP modeling of the mice was performed at the 10th week of age. Following the induction of sepsis, mice were anesthetized with 100 mg/kg ketamine (HUONS, Seoul, Korea) and 10 mg/kg xylazine (Bayer Korea, Seoul, Korea) for 24 hours. After performance of a cardiac ultrasound, orbital blood was drawn and the heart was harvested for Western blot analysis and histological examination. Blood samples were anticoagulated with 10% sodium ethylenediamine tetraacetate (EDTA) at 4°C for 3 hours, centrifuged at 3000 rpm for 10 minutes, followed by serum collection which was kept in a refrigerator at a temperature of −80°C.
In strict compliance with the National Organizations of the Guide for the Care and Use of Laboratory Animals of Health, the study was conducted, and all operations on mice were sanctioned by the China Medical University Standards for the Laboratory Animals Welfare and Ethical Review (CMU 20211201) with a permit.
Echocardiography
The Vevo 2100 system (Visual Sonics) was employed to assess cardiac contractile function through transthoracic M-mode echocardiography.
Histopathological analysis
Hematoxylin and eosin (H&E) staining from Beijing Solabao, China (G1120) was used to assess the histochemistry of the remodeled animals. After 10% paraformaldehyde buffer had been used to fix mouse heart tissues for 24 hours, gradient alcohol dehydration and paraffin coating were performed. Subsequently, 5 μm thick paraffin sections were cut and dried in a 37°C incubator. Subsequently, xylene dewaxing was performed, and the slides were then subjected to H&E staining kits in accordance with the manufacturer’s instructions.
Tissue immunofluorescence
Fluorescein-labeled antibodies were used against the respective antigens. PBS was replaced every 10 min to maintain the specimen humidity. The specimen was covered with fluorescent-labeled antibodies and stored in an enamel box for 30 min. The glass slide was rinsed with PBS solution in three cylinders, each washed for 3–5 min under oscillation. The glass slide was observed under a fluorescence microscope, after which a drop of glycerol was added to cover it, and the surplus moisture removed. The primary antibodies CD163 (1:500, Abcam, ab182422) and Arg1 (1:500, Abcam, ab96183) came from Abcam (Cambridge, London, UK), and the secondary fluorescence immunoglobulin G came from Abmart (1:1000, M21014S, Shanghai, China).
Serum myocardial injury indicators
Using the Elabscience enzyme-linked immunosorbent assay (ELISA) kit (Wuhan, China), 24 hours post-reperfusion, the concentrations of creatine kinase MB isoenzyme (CK-MB, E-EL-M1203c), lactate dehydrogenase (LDH, E-EL-M0419c), and troponin I (cTnI, E-EL-M1203c) in the serum were determined in accordance with the instructions.
Cell culture
From the American Type Culture Collection (ATCC, Manassas, VA, USA), THP-1 cells were procured and cultured in RPMI-1640 medium (high quality 10% fetal bovine serum (FBS); 0.05 mM β-mercaptoethanol; 1% penicillin/streptomycin). Subsequently, 100 ng/ml phorbol myristic acid acetate (PMA) was administered to THP-1 monocytes to induce M0 macrophages for 24 hours. Subsequently, M1 macrophages were exposed to 50 ng/ml LPS for 48 hours, while M2 macrophages were incubated with 20 ng/ml human IL-4 for the same duration. M1-like macrophages are the product of the iNOS pathway, which produces citrulline and NO from arginine, while M2-like macrophages are the product of the arginase pathway, which produce ornithine and urea [15] from arginine. CD86 and CD80 are the known M1 markers, and CD163 and CD206 are the known M2 markers [16]. Characterized by proinflammatory and antimicrobial effects, M1 macrophages release copious amounts of proinflammatory factors, such as IL-6, IL-18, IFN-γ, and TNF-α, whereas M2 macrophages are distinguished by anti-inflammatory effects, such as IL-10 [17]. Employing ELISA and qRT-PCR, we were able to detect the inflammatory factors IL-6, IL-1β, TNF-α, and IL-10. Additionally, flow cytometry was utilized to detect the surface markers (PE anti-human CD86 and APC anti-human CD206, both from BioLegend, San Diego, CA, USA) of stimulated cells.
Culturing AC16 human cardiomyocyte lines in DMEM: F12, supplemented with 10% FBS, 1% penicillin-streptomycin, and 1% fungizone (Invitrogen), was done in a humid atmosphere of 5% CO2 at 37°C until reaching a confluence of 70–80%.
Cell transfection
The over-expressed Hmgcs2 lentivirus was conceived and synthesized by GeneChem (Shanghai, China). Full-length cDNA encoding Hmgcs2 was amplified from pCMV3-Hmgcs2 plasmid then inserted into pCDH-CMV-MCS-EF1-Puro vector to obtain Hmgcs2-overexpressing plasmid pCDH-Hmgcs2. HEK293T cells were co-transfected with pCDH-Hmgcs2 and packaging plasmids (pMD2 and pAX2) to obtain lentivirus particles of pCDH-Hmgcs2. Following this, the cells were transfected with the relevant reagents, following the manufacturer’s instructions, using Lipofectamine™ 3000 (Thermo Fisher Scientific, Waltham, MA, USA). THP-1 cells were infected with concentrated pCDH-Hmgcs2 lentivirus particles and then screened by puromycin to obtain stable Hmgcs2-overexpressed THP-1 cell line. Subsequent experiments employed the Src selective inhibitor PP1(1 μM), with cells pre-treated for 1 h.
Cell counting Kit-8 assay (CCK-8)
AC16 cells were co-cultured with different condition mediums of macrophages for 24 h; AC16 (2 × 10³) were seeded into 96-well plates (Corning, NY, USA). At the designated hour, 10 μl of CCK-8 (Beyotime, Jiangsu, China) was added to each well. After 1 hour of incubation at 37°C, the absorbance at 450 nm was determined using an automatic microplate reader (Synergy4; BioTek, Winooski, VT, USA).
Co-culturing and conditioning of the medium preparation with macrophages
The AC16 cells were washed and cultured with fresh medium or CM from macrophages with or without overexpressed Hmgcs2 lentivirus or PP1, to assess the effects of macrophages regulated by Hmgcs2/Src on AC16 cells. To obtain a conditioned medium (CM) of macrophages, the cell medium was collected and centrifuged at 3000 rpm for 10 minutes at 4°C.
Western blot (WB)
Tissue proteins were extracted according to kit instructions (Sigma Aldrich, R0278, St. Louis, MO, USA). Quantifying protein concentrations and samples was done routinely with a BCA kit (Beyotime Biotechnology, P0010S, Beijing, China) from Louis, MO, USA. SDS-PAGE of 30 μg was conducted on each sample using either 8% or 12% SDS-PAGE, and then the semi-dry transfer was made to PVDF membranes. After blocking with 5% skim milk prepared with TBST for 1 h at room temperature, the membranes were incubated overnight at 4°C with pre-diluted primary antibodies. The secondary antibody was then incubated with the membrane for 1 hour at room temperature after it had been washed. The dilution ratios of all antibodies were as follows: Hmgcs2 (1:500, Abcam, ab137043, Cambridge, London, UK), Src (1:500, Abcam, ab109381, Cambridge, London, UK), p-PI3K (1:500, CST, Cell Signaling Technology, #17366, Danvers, MA, USA), PI3K (1:500, CST, #4292), p-AKT (1:500, CST, #4060), AKT (1:500, CST, #4685), and GAPDH (1:500, CST, #97166).
Real-time quantitative PCR analysis (RT-qPCR)
Trizol and enzyme RNA Extraction Kit (Takara, RR820A, China) were employed to extract total RNA from the heart, and 1 μg of the RNA was reverse-transcribed with a reverse transcription Kit (Takara, RR047A, China). Real-time quantitative PCR was then conducted with gene-specific primers and a 7500abi biological system machine, and the absolute mRNA number was determined by comparing it to the threshold.
Enzyme-linked immunosorbent assay (ELISA)
Using ELISA kits from Elabscience (Wuhan, China), the concentrations of IFN-β (E-MSEL-M0003), TNF-α (E-EL-M3063), IL-6 (E-EL-M0044c), IL-1β (E-MSEL-M0003), IL-10 (E-EL-M0046c) in the mice serum and TNF-α (E-EL-H0109c), IFN-β (E-EL-H0085c), IL-6 (E-EL-H6156), IL-10 (E-EL-H6156) in the cells were measured. The OD value was then determined using the Microplate Reader from Multiskan Spectrum (Thermo Scientific, Waltham, MA, USA).
Flow cytometry
Flow cytometry was used to detect the surface markers of THP-1 cells that had been stimulated for 24 hours and collected from 6-well plates. The suspension, which had 1 × 10⁶ M1-polarized and M2-polarized cells, was then divided into 1.5 ml EP tubes and incubated with the following antibodies (PE anti-human CD86 and APC anti-human CD206; both from BioLegend, San Diego, CA, USA) on ice for 30 min in the dark. Flow cytometry (BD Biosciences, San Diego, CA, USA) was used to detect cells that had been suspended in 500 μl PBS with 3% FBS after being washed twice.
Apoptosis detection by annexin V/PI double staining
The Annexin V-FITC Apoptosis Detection Kit (560931, BD, United States) was utilized to measure the rate of cell apoptosis, as per the manufacturer’s instructions. To summarize, the AC16 cells were seeded in 6-well plates (5 × 10⁵/well), harvested and resuspended in the binding buffer, followed by co-incubation with 5 μl of Annexin V-FITC and 5 μl of PI for 20 minutes in the dark at room temperature. Flow cytometry (BD Biosciences, San Diego, CA, USA) was utilized to analyze the cells within 1 h, and FlowJo 10.4.2 software (BD Biosciences) was then utilized to analyze the data.
Bioinformatics analysis
At the National Center for Biotechnology Information (NCBI), GEO datasets were searched for the Sepsis-related transcriptome dataset (GSE171546). Based on the mRNA gene expression profile of model mice in time sequence, the time-related differential mRNA of CLP mice was explored. Using the R language’s ImpulseDE2 software package, the transcriptome data in the heart tissue of CLP mice was discovered. The expression matrix was analyzed by intergroup analysis and principal component analysis (PCA). The differential gene expression between CLP and control groups was predicted by a linear model analysis using the Bioconductor package “DESeq2” [18]. Using the Bioconductor package “clusterProfiler”, the key pathway information was obtained and visualized using R language [19], for Gene Ontology (GO) and Kyoto Encyclopedia of Genes and Genomes (KEGG) metabolic pathway enrichment analyses. Additionally, the “fgsea” R package was employed to perform Gene Set Enrichment Analysis (GSEA) on the entire differential gene set, and the results were visualized.
Data analysis
GraphPad Prism 8.0 (GraphPad Inc, La Jolla, CA, USA) was employed to conduct all statistical analyses. The continuous variables were expressed as mean ± standard deviation
Consent to participate and publish
Prior to assessing eligibility, all participants gave written informed consent and were made aware that the data would be made public.
Results
Hmgcs2 plays a regulatory role in myocardial injury in CLP mice
Transcriptome data of heart tissues from CLP mice at different times were obtained by mining GEO public data. Employing time series-based differential gene analysis, it revealed significant and diametrically opposite changes in the high and low expression of transcribed genes in CLP mice over time (Figure 1A). We performed a summary of the top 20 genes that changed significantly over time (Figure 1C). Next, we performed a differential analysis of transcribed genes 72 h after CLP. First, we performed principal component analysis on data samples from the 72-hour group (72 h) and the 0-hour control group (control) and showed that the two groups differed greatly (Figure 1B). Results of the differential analysis showed that compared to 305 genes regulated in the control group, there were 210 genes regulated in the 72 h group (Figure 1D). Alignment of the differential genes in the 72 h and control groups of CLP mice with the genes in the top 20 of temporal regulation revealed that only the gene (ENSMUSG00000027875, Hmgcs2) was significantly differentially expressed in both analysis methods, identifying it as the key differential gene.
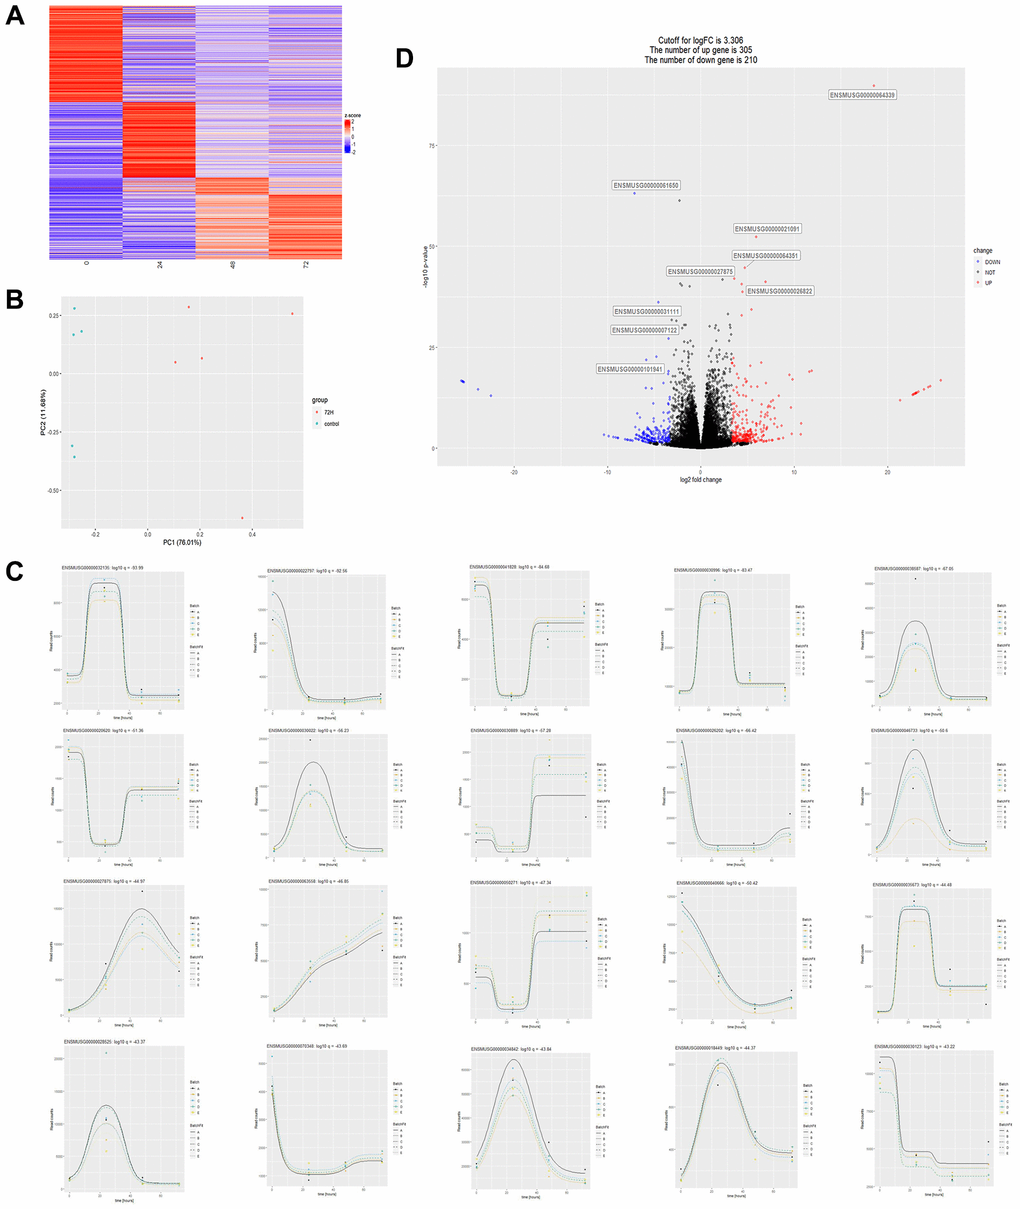
Figure 1. Transcriptome data analysis of cardiac tissues from CLP mice at different times. (A) Heatmap of the overall change of a gene over time, where the abscissa represents time, the vertical axis represents the amount of relative change of a gene, and the redder the color represents the more up-regulated fold of a gene, the more downregulated fold. (B) Principal component analysis plot (PCA) of two sets of sample data at 72 and 0 hours after CLP in the dataset. (C) The statistical plot of the top 20 differential genes over time, with the abscissa representing time and the ordinate representing the amount of expression of a single gene. (D) Differential gene volcano plot between 72H and control: 305 differentially expressed genes were up-regulated, and 210 differentially expressed genes were down-regulated with a logFC (relative expression of genes) cut-off value of 3.306, P < 0.05.
Inhibition of Hmgcs2 aggravates myocardial injury
A comparison of ELISA results between the sham-operated group (sham), sham plus ASO (for silencing hmgcs2) administrated group (sham + ASO), CLP model group (CLP), and CLP plus ASO administrated group (CLP + ASO) was conducted in order to further explore the regulatory role of Hmgcs2 in CLP mice. Results indicated a significant increase in the protein content of cardiac function markers LDH, CK-MB, and cTnI in the CLP Group. The serum concentrations of these proteins were augmented by ASO administration (Figure 2A–2C).
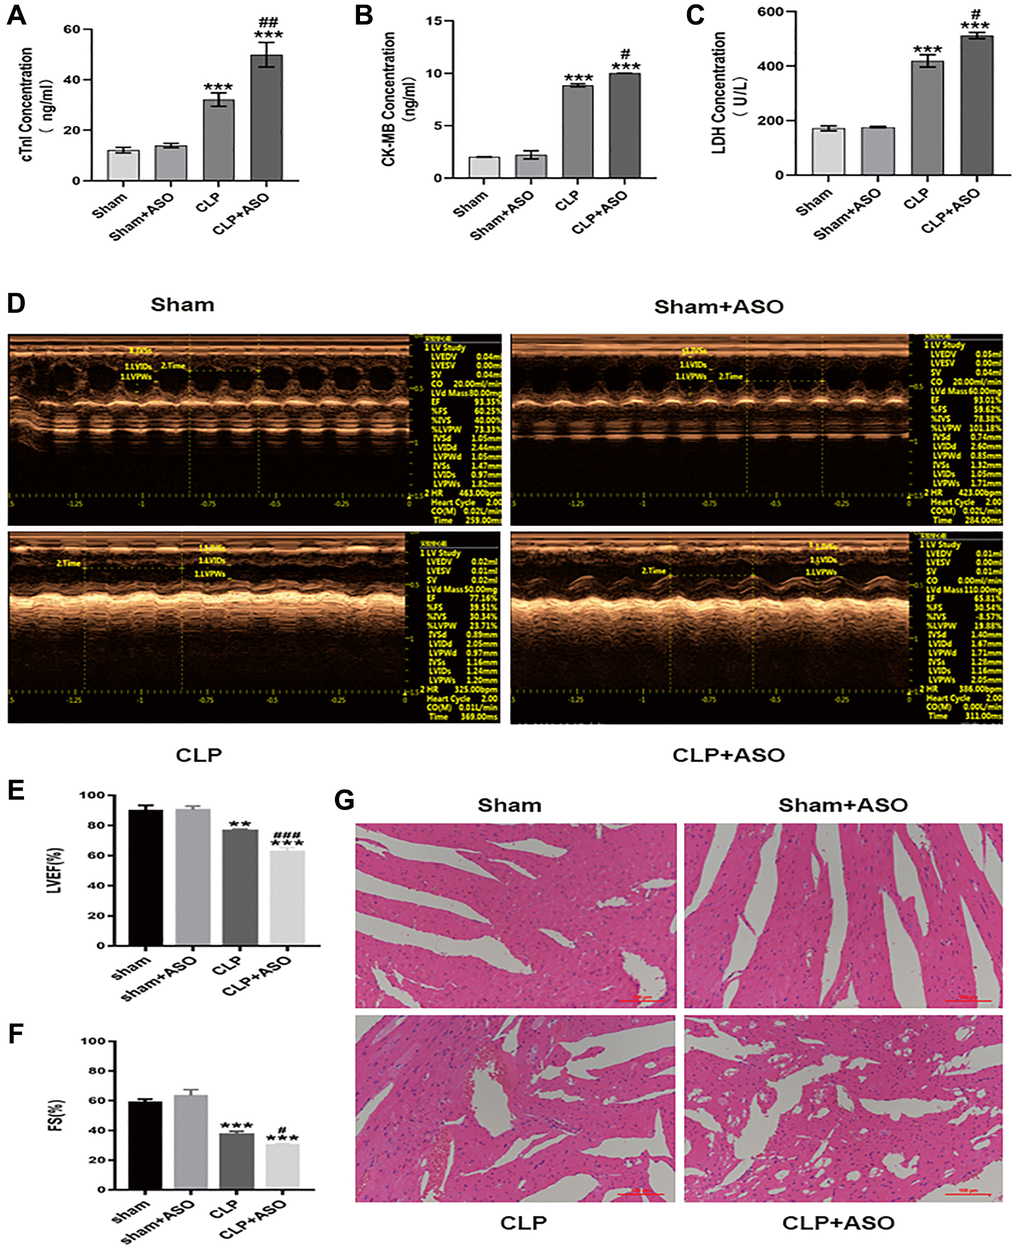
Figure 2. Inhibition of hmgcs2 aggravates myocardial injury in CLP mice. (A–C) Protein contents of cTnI, CK-MB, and LDH in the serum from mice in each group. (D) Echocardiography of mice in each group. (E, F) Echocardiographic statistical analysis of left ventricular ejection fraction (LVEF) and systolic fraction (FS). (G) H&E staining of mice heart tissues in each group (magnification 400×). Sham: sham group (n = 6); Sham + ASO: sham surgery plus ASO administration group (n = 6); CLP: septic myocarditis model group in CLP operated mice (n = 6); CLP + ASO: CLP plus ASO administration group (n = 6). *P < 0.05, **P < 0.01, ***P < 0.001: vs. sham group; #P < 0.05, ##P < 0.01, ###P < 0.001: vs. CLP group.
Echocardiography (Figure 2D) revealed a significant decrease in left ventricular ejection fraction (LVEF) and LV systolic function (Fractional shortening; FS) in CLP mouse hearts, as assessed by the cardiac function of each group. (Figure 2E, 2F). Moreover, the CLP + ASO group further decreased LVEF and FS.
The main pathological changes in the hearts of CLP mice included marked edema of the cardiomyocytes with vacuoles, cell deformation, necrosis, sloughing, and diffuse inflammatory cell infiltration, consistent with myocardial injury. The cardiac morphology by H&E staining (Figure 2G), comparison of the sham and CLP groups revealed that the former had caused harm to the myocardium, with myofiber tearing, cell deformation, necrosis, and inflammatory cell infiltration. The CLP + ASO group’s morphology further exacerbated the myocardial injury, while the sham + ASO group showed no difference.
Inhibition of Hmgcs2 aggravates inflammatory response and reduces M2 macrophages in the heart
Classically M1 and alternative M2 polarization, with pro- and anti-inflammatory properties, respectively, divide macrophages - heterogeneous immune cells with pleiotropic functions – fundamentally [12]. Characterized by proinflammatory and antimicrobial effects, M1 macrophages release copious amounts of proinflammatory factors such as IL-6, IL-1β, IFN-γ, and TNF-α, which can aggravate the inflammatory response; however, M2 macrophages, which secrete IL-10 and IL-4, have anti-inflammatory effects [20]. Our research revealed that the CLP group had notably higher levels of measured inflammatory factors. The inflammatory release of IL-1β, IL-6, and TNF-α was exacerbated by the serum concentrations of IL-1β, IL-6, IL-10, and TNF-α (Figure 3A, 3B, 3D), and ASO administration further exacerbated this. Notably, the expression of the anti-inflammatory factor IL-10 was decreased (Figure 3C), which is normally released by innate immune cells (e.g., M2 type macrophages), in the CLP + ASO group compared to the CLP group.
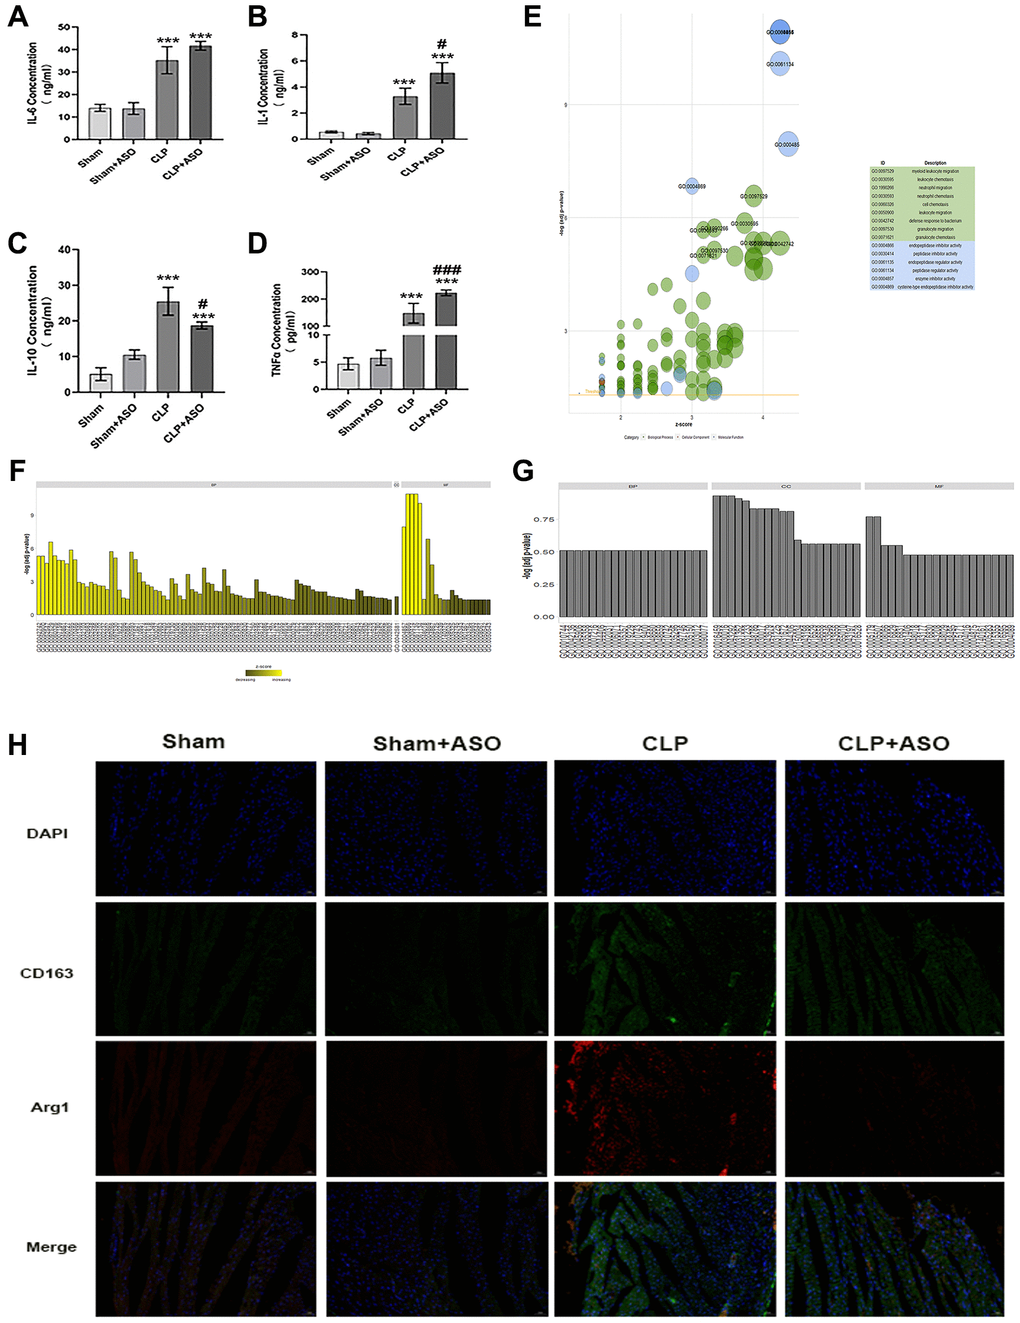
Figure 3. Inhibition of Hmgcs2 aggravates inflammatory response and reduces M2 macrophages in the heart of CLP mice. (A) The concentrations of the inflammatory factor IL-1β in the serum of mice in each group (ng/ml). (B) The concentration of IL-6 in the serum of mice in each group (ng/ml). (C) The concentration of IL-10 in the serum of mice in each group (ng/ml). (D) The concentrations of TNF-α in the serum of mice in each group (pg/ml). (E) GO enrichment results are exhibited in a bubble plot, with bubble size representing how many enriched genes are and different colors representing different kinds of GO units. (F) The bar graph exhibits the enrichment results for the up-regulated genes GO enrichment analysis results. (G) GO enrichment analysis results of down-regulated genes. (H) Immuno-fluorescence co-localization of heart samples from CLP mice. Where green fluorescence represents CD163, red fluorescence represents Arg1, blue represents nuclei (DAPI), and the bottom is a composite (merge) diagram (magnification 400×). Sham: sham group (n = 6); Sham + ASO: sham surgery plus ASO administration group (n = 6); CLP: septic myocarditis model group in CLP operated mice (n = 6); CLP + ASO: CLP plus ASO administration group (n = 6). *P < 0.05, **P < 0.01, ***P < 0.001: vs. sham group; #P < 0.05, ##P < 0.01, ###P < 0.001: vs. CLP group.
The top differential genes (Database of Essential Genes; DEG) were enriched through Gene Ontology (GO), with P < 0.05 as the filtering criterion. GO units were divided into three categories: biological process (BP), molecular function (MF), and cellular component (CC). The data indicated that DEGs were mainly enriched in GO units such as myeloid leukocyte migration, leukocyte chemotaxis, and positive regulation of macrophage-derived foam cell differentiation (Figure 3E–3G). The results demonstrated that macrophages were important for the regulation of myocardial injury in CLP mice.
Combined with the previously noted decrease in IL-10 (Figure 3C), we reasoned that Hmgcs2 might somehow be associated with M2-type macrophages in cardiac tissues of CLP mice. We mapped M2-type macrophage infiltration in the heart of CLP mice by co-immunofluorescence of CD163 and Arg1, and there was more M2-type macrophage infiltration in the CLP group compared with the sham group, which was reduced by ASO administration (Figure 3H).
Activation of the Src/PI3K/AKT pathway by Hmgcs2 induces macrophage polarization towards M2
To gain insight into the regulatory mechanism of myocardial injury in CLP mice, we performed a KEGG enrichment analysis on the DEGs previously analyzed. Enriched pathways of osteoclast differentiation, B cell receptor signaling, neutrophil extracellular trap formation, cytokine receptor interaction, staphylococcus aureus infection, tuberculosis, tyrosine metabolism, rheumatoid arthritis, cholesterol metabolism, retinol metabolism, and mineral absorption were revealed in the DEGs’ up-regulated genes (Figure 4A). Downregulated genes were enriched in pathways involved in Apelin signaling, GABAergic synapses, complement and coagulation cascades, neuroactive ligand-receptor interactions, and glutamatergic synapses (Figure 4C). Enriched genes were also introduced into enriched pathways (Figure 4B, 4D). Among these, the KEGG pathways with the strongest association with macrophage polarization were osteoclast differentiation pathways (Figure 4D). Osteoclast differentiation pathways (Figure 4E) were the most strongly correlated with macrophage polarization, and activation of the Src/PI3K/Akt pathway was essential in restraining pro-inflammatory reactions and encouraging anti-inflammatory reactions in macrophages [21].
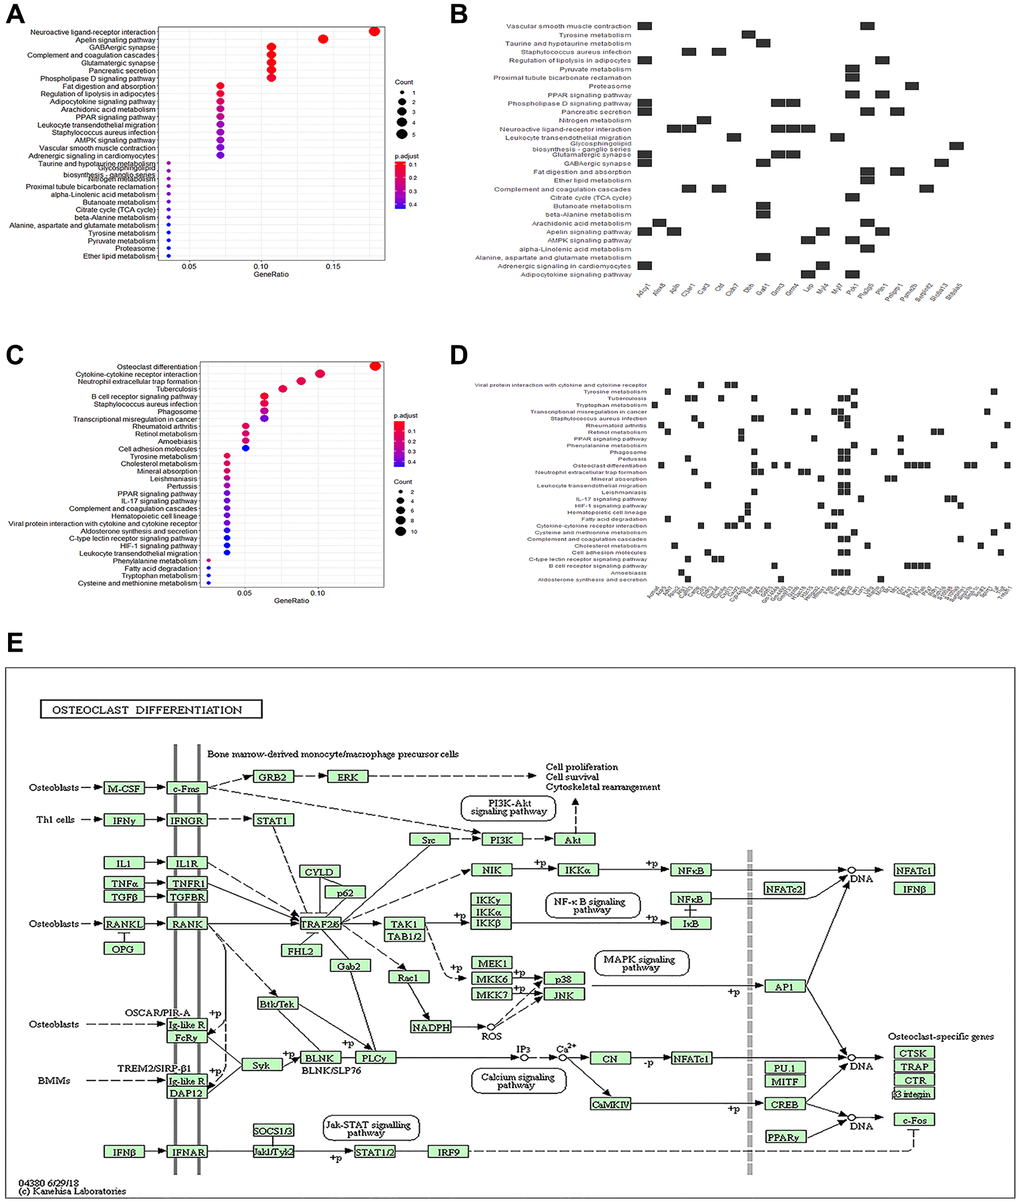
Figure 4. KEGG enrichment analysis of differential genes. (A) The bubble plot exhibits the KEGG enrichment analysis results of the up-regulated genes. (B) Heatmap of correlation between KEGG pathways and enriched genes of up-regulated genes. (C) The bubble plot exhibits the KEGG enrichment analysis results of down-regulated genes. (D) Heatmap of correlation between KEGG pathways and enriched genes of down-regulated genes. (E) KEGG pathway plot.
We conducted in vitro cell experiments to delve deeper into the regulatory part Hmgcs2 plays on macrophages. THP-1 cells were induced into macrophages by transfection or administration in four different groups, including control (NC), empty plasmid transfection (NC+ empty), Hmgcs2 over-expression (Hmgcs2), and Hmgcs2 over-expression based on the administration of the Src inhibitor PP1(Hmgcs2+ PP1).
First, regulation of Src/PI3K/AKT by Hmgcs2 in macrophages was demonstrated via transfection of plasmids and PP1 administration. The Hmgcs2 group displayed a rise in protein expression of Src, and a rise in phosphorylation levels of PI3K and AKT when compared to the NC group. As expected, PP1 administration decreased Src expression and decreased phosphorylation levels for PI3K and AKT in the Hmgcs2+ PP1 group, but had no effect on Hmgcs2 (Figure 5A, 5B).
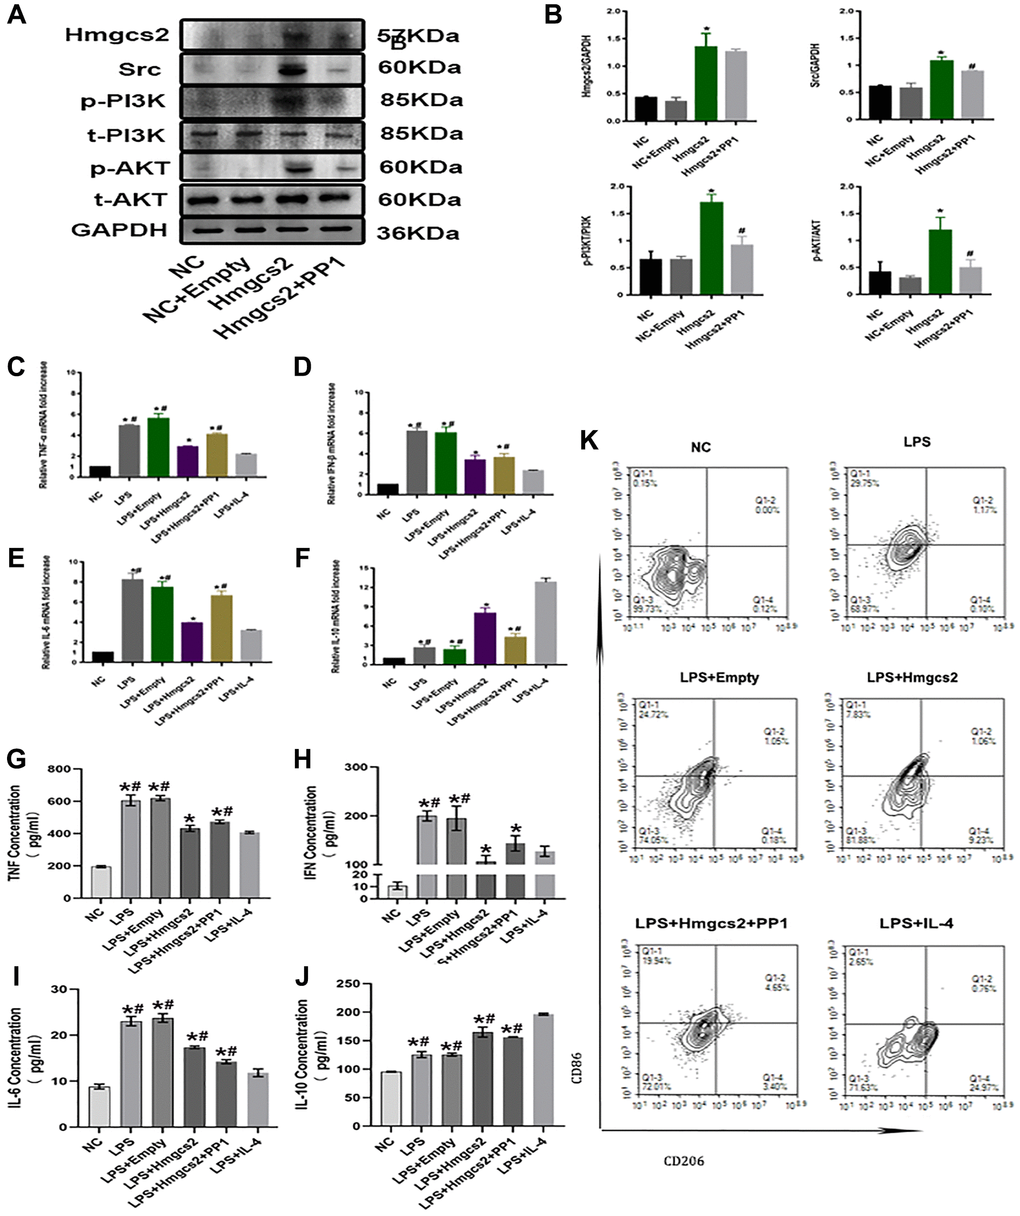
Figure 5. Hmgcs2 promotes macrophage M2 polarization by activating Src/PI3K/AKT pathway. (A) Relative expression of Hmgcs2 and Src/PI3K/AKT pathway-related proteins in cells from each group. (B) Statistical results of relative expression of Hmgcs2 and Src/PI3K/Akt pathway-related proteins of cells in each group. (C) The mRNA relative expression of TNF-α of macrophages in each group. (D) The mRNA relative expression of IFN-β of macrophages in each group. (E) The mRNA relative expression of IL-6 of macrophages in each group. (F) The mRNA relative expression of IL-10 of macrophages in each group. (G) Concentrations of TNF-α for macrophages in each group (pg/ml). (H) The concentration of IFN-β in the macrophages of each group (pg/ml). (I) The concentration of IL-6 in macrophages from each group (pg/ml). (J) The concentration of IL-10 in macrophages from each group (pg/ml). (K) The flow cytometry of the macrophage polarization in distinct groups. Abbreviations: NC: control group; LPS: LPS induced M1 type macrophages; LPS+ empty: M1 macrophage group transfected with empty plasmid; LPS+Hmgcs2: Hmgcs2 over-expressing M1 macrophage group; LPS+Hmgcs2+PP1: M1 macrophages with over-expression of Hmgcs2 based on PP1 administration; LPS+IL-4: LPS+IL-4 induced M2 type macrophages. *P < 0.05, **P < 0.01, ***P < 0.001: vs. NC group; #P < 0.05, ##P < 0.01, ###P < 0.001: vs. LPS + HMGCS2 group.
Next, the inflammatory release profile of macrophages was investigated. Transcriptionally, LPS-induced mRNA expression of these inflammatory factors, including TNF-α, IFN-β, IL-6, and IL-10, was elevated in macrophages compared with the NC group (Figure 5C–5F). The ELISA experiments revealed that LPS-induced macrophages had augmented concentrations of TNF-α, IFN-β, IL-6, and IL-10 compared to the NC group, despite Hmgcs2’s over-expression causing a decrease in mRNA expression of these inflammatory factors in macrophages and an increase in transcriptional activity of IL-10. PP1 administration, however, reversed these effects. Hmgcs2’s over-expression, however, had a deleterious effect on LPS-induced TNF-α, IFN-β, and IL-6 levels, while concurrently raising IL-10 concentrations in macrophages. Again, however, PP1 administration reversed the effect of Hmgcs2 (Figure 5G–5J).
We explored the influence of Hmgcs2 on macrophage polarization, utilizing flow cytometry to quantify macrophage polarization in distinct groups. The results showed that overexpression of Hmgcs2 promoted macrophage M1 to M2 polarization, whereas PP1 administration reversed this phenomenon (Figure 5K).
Hmgcs2 restores cardiomyocyte viability and reduces cardiomyocyte apoptosis by promoting macrophage M2 polarization
Cardiomyocyte activity was affected by Hmgcs2 by regulating macrophages in a cell co-culture experiment. CCK-8 cell viability results showed that in comparison to the NC group, LPS-induced macrophages reduced the activity of cardiomyocytes after being co-cultured with cardiomyocytes (Figure 6A), whereas cardiomyocyte activity was restored in the LPS+Hmgcs2 group co-cultured with cardiomyocytes. The LPS+IL-4 group saw a heightened level of activity in cocultured cardiomyocytes.
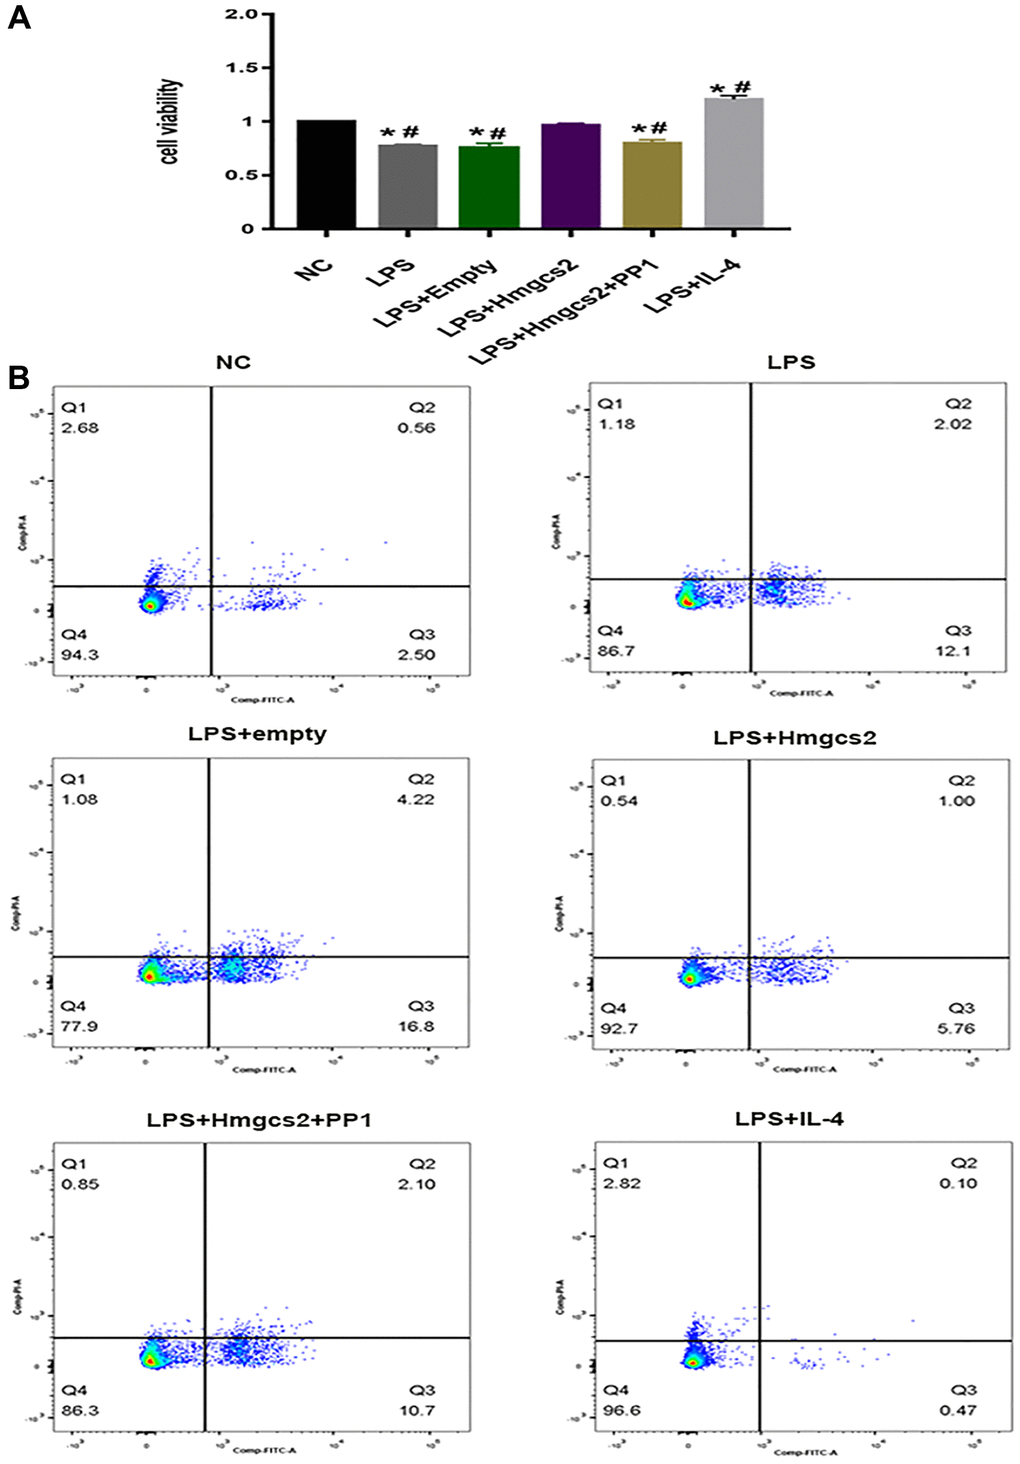
Figure 6. Hmgcs2 affects cardiomyocyte activity via macrophage polarization. (A) CCK-8 experiments showed the effects of different groups of macrophages on the activity of cardiomyocytes after co-culture with cardiomyocytes. (B) Flow cytometry experiments showed the effects of different groups of macrophages on cardiomyocyte apoptosis after co-culture with cardiomyocytes. Abbreviations: NC: control group; LPS: LPS induced M1 type macrophages; LPS+ empty: M1 macrophage group transfected with empty plasmid; LPS+Hmgcs2: Hmgcs2 over-expressing M1 macrophage group; LPS+Hmgcs2+PP1: M1 macrophages with over-expression of Hmgcs2 based on PP1 administration; LPS+IL-4: LPS+IL-4 induced M2 type macrophages. *P < 0.05, **P < 0.01, ***P < 0.001: vs. NC group; #P < 0.05, ##P < 0.01, ###P < 0.001: vs. LPS + HMGCS2 group.
Furthermore, apoptosis of cardiomyocytes was investigated by flow cytometry with a co-cultured experiment. Apoptotic flow cytometry revealed that, in comparison to the NC group, cardiomyocytes in LPS-induced macrophages co-cultured with cardiomyocytes experienced an increase in apoptosis (Figure 6B); however, the LPS+Hmgcs2 group experienced a decrease in apoptosis. The LPS+IL-4 group showed the least apoptosis in co-cultured cardiomyocytes.
Discussion
The long-standing mortality rate linked to sepsis, a systemic, detrimental inflammatory reaction to infection or injury [22], has been largely attributed to multi-organ dysfunction and failure [23, 24]. Notably, cardiac dysfunction is especially common during sepsis, which is a major contributor to the high mortality rate associated with it [25–27].
Invoking multiple mechanisms linked to septic myocardial dysfunction, such as oxidative stress overabundance, cardiomyocyte apoptosis, cardiac contractile malfunction, and persistent inflammation [28–30], the treatment of this potentially fatal condition is often inadequate and only marginally successful, particularly when the present comprehension of its pathophysiology is still disturbingly unclear. We conducted a public data mining analysis of the transcriptome results of CLP mice to explore the regulatory mechanism of sepsis-induced myocardial injury, discovering that Hmgcs2 was highly expressed in the cardiac tissues of the mice and could be a crucial factor in the condition (Figure 1).
Hmgcs2 is one of the main control points of ketogenesis during ketone body metabolism. The potential for ketone bodies to have beneficial effects on the heart, especially in the case of experimental ischemia/reperfusion injury, could be a cardioprotective factor, potentially due to an augmented concentration of cardiac mitochondria or an increase in the amount of essential oxidative phosphorylation mediators [7, 8]. Hmgcs2 generates ketone bodies including acetoacetate, acetate, and β- Hydroxybutyric acid (β OHB) [31]. Additionally, β OHB was found to be capable of inhibiting NF-κB through partial translocation, as well as reducing the expression of pro-inflammatory proteins (iNOS, COX-2) or cytokines (TNF-α, IL-1β, IL-6, CCL2/MCP-1) [32], it was also observed that β OHB could inhibit the NLRP3 inflammasome in bone marrow-derived macrophages. The present study demonstrated that Hmgcs2 had a positive effect on myocardial function in CLP mice, and its inhibition further exacerbated the symptoms (Figure 2), quite likely caused by aggravating inflammation (Figure 3A–3D). Our research revealed a remarkable rise in the levels of inflammatory factors in the CLP group, such as serum concentrations of IL-1β, IL-6, IL-10, and TNF-α. Furthermore, ASO administration further exacerbated the inflammatory release of IL-1β, IL-6, and TNF-α (Figure 3A–3C). Notably, the expression of the anti-inflammatory factor IL-10 was decreased (Figure 3D). Interleukin-10 (IL-10), a cytokine, is a major anti-inflammatory agent and plays a pivotal part in controlling and terminating inflammatory reactions [33]. The up-regulating of the production of IL-10 has beneficial effects in sepsis mouse models [34–36]. Macrophages, especially M2 macrophages, are the most prominent cell population expressing the immunoregulatory cytokine IL-10 [37]. Studies have demonstrated that IL-10 secreted by macrophages, particularly immune cells, is a critical factor in the battle against sepsis.
Macrophages, heterogeneous immune cells with pleiotropic functions [38], are fundamentally divided into classically M1 and alternative M2 polarization with pro- and anti-inflammatory property, respectively [39]. The production of inflammatory mediators by macrophages in sepsis hyper-inflammation is noteworthy, as they are the main factor in M1 polarization [40]. Consequently, the introduction or administration of anti-inflammatory M2 macrophages during sepsis hyper-inflammation is advantageous. The production of M1-like macrophages, stemming from the iNOS pathway, which yields citrulline and NO from arginine, and M2-like macrophages, from the arginase pathway, which yields ornithine and urea from arginine [15], is the source of the M1/M2 polarity, which is caused by two opposing pathways. CD86 and CD80 are the known M1 markers, and CD163 and CD206 are the known M2 markers [17]. Characterized by proinflammatory and antimicrobial effects, M1 macrophages release a great deal of proinflammatory factors such as IL-6, IL-18, IFN-γ, and TNF-α, which can exacerbate the inflammatory response; however, M2 macrophages are distinguished by their anti-inflammatory properties [20, 41]. GO enrichment analysis showed the association of macrophages with myocardial injury in CLP mice (Figure 1). The inhibition of Hmgcs2 exacerbated the inflammatory response and decreased M2 macrophages in the heart (Figures 2 and 3), that is Hmgcs2 can regulate M2 polarization of macrophages to repair myocardial injury induced by sepsis.
The mechanism by which Hmgcs2 regulated macrophage polarization was further investigated, first by identifying the critical role of Src/PI3K/Akt through KEGG enrichment analysis (Figure 4). The PI3K/Akt signaling pathway is known to be a crucial factor in macrophage M2 activation in reaction to surfactant protein A or IL-4. Additionally, IL-10, TGF-β, and BMP-7 are known to induce M2 polarization [21]. However, Hmgcs2 could bind with peroxisome proliferator-activated receptors α (PPAR α) directly to promote Src activity [42]. Concordant with prior studies, the present study found that overexpressed Hmgcs2 could activate the Src/PI3K/Akt pathway to promote macrophage M2 polarization and thus reduce the release of pro-inflammatory factors from macrophages (Figure 5). Finally, to demonstrate the direct effect of macrophage polarization on cardiomyocytes, M2-type macrophages were able to reduce cardiomyocyte apoptosis and enhance cardiomyocyte activity when co-cultured with them in vitro (Figure 6).
Studies have indicated a correlation between a lack of ketogenesis and a range of inflammatory ailments, with Hmgcs2 being the essential rate-limiting enzyme for ketogenesis. Ketogenic insufficiency by ASO- mediated Hmgcs2 knockdown in adult mice leads to liver inflammation and injury [43, 44]. Hmgcs2 ketogenesis acts as an endogenous protective program during acute pancreatitis by suppressing inflammatory macrophage activation [45]. In our study, an endogenous protective mechanism of Hmgcs2 during septic myocardial injury was proposed. Namely, Hmgcs2 acts as a protective program by suppressing pro-inflammatory macrophage activation and promoting anti-inflammatory phenotype, in which the phenotypic shift of macrophages is achieved through Hmgcs2 regulated Src/PI3K/AKT. Providing a novel theoretical basis for prevention and treatment, it offers a protective mechanism against septic complications.
Conclusion
To conclude, the current research revealed the protective power of Hmgcs2 against septic myocardial injury, by stimulating macrophage M2 polarization to diminish inflammation induced by sepsis and decreasing cardiomyocyte apoptosis to lessen myocardial injury through the activation of the Src/PI3K/Akt pathway (Supplementary Figure 1).
Supplementary Materials
Author Contributions
Xiao-Zheng Zou: Conceptualization, Data curation, Funding acquisition, Methodology, Project administration, Writing – original draft, Writing – review and editing. Jun-Feng Hao: Formal analysis, Methodology, Visualization Writing – original draft. Ming-Xiao Hou: Writing – review and editing.
Conflicts of Interest
The authors declare no conflicts of interest related to this study.
Ethical Statement
The Ethics Committee of China Medical University approved the protocol of this study (Ethical Lot Number: CMU2021201). The study was conducted, and all operations on mice were performed in strict compliance with the National Organizations of the Guide for the Care and Use of Laboratory Animals of Health.
Funding
Key Projects of Liaoning Provincial Department of Education (No. LJKZ1153).
References
- 1. Wu H, Liao B, Cao T, Ji T, Huang J, Ma K. Diagnostic value of RDW for the prediction of mortality in adult sepsis patients: A systematic review and meta-analysis. Front Immunol. 2022; 13:997853. https://doi.org/10.3389/fimmu.2022.997853 [PubMed]
- 2. Hsu JF, Yang MC, Chu SM, Yang LY, Chiang MC, Lai MY, Huang HR, Pan YB, Fu RH, Tsai MH. Therapeutic effects and outcomes of rescue high-frequency oscillatory ventilation for premature infants with severe refractory respiratory failure. Sci Rep. 2021; 11:8471. https://doi.org/10.1038/s41598-021-88231-6 [PubMed]
- 3. Xiao Z, Kong B, Fang J, Qin T, Dai C, Shuai W, Huang H. Ferrostatin-1 alleviates lipopolysaccharide-induced cardiac dysfunction. Bioengineered. 2021; 12:9367–76. https://doi.org/10.1080/21655979.2021.2001913 [PubMed]
- 4. Wei A, Liu J, Li D, Lu Y, Yang L, Zhuo Y, Tian W, Cong H. Syringaresinol attenuates sepsis-induced cardiac dysfunction by inhibiting inflammation and pyroptosis in mice. Eur J Pharmacol. 2021; 913:174644. https://doi.org/10.1016/j.ejphar.2021.174644 [PubMed]
- 5. Kume S. Ketone bodies: back to a place in the sun. Kidney Int. 2021; 100:976–8. https://doi.org/10.1016/j.kint.2021.07.022 [PubMed]
- 6. Lopaschuk GD, Karwi QG, Ho KL, Pherwani S, Ketema EB. Ketone metabolism in the failing heart. Biochim Biophys Acta Mol Cell Biol Lipids. 2020; 1865:158813. https://doi.org/10.1016/j.bbalip.2020.158813 [PubMed]
- 7. Puchalska P, Crawford PA. Multi-dimensional Roles of Ketone Bodies in Fuel Metabolism, Signaling, and Therapeutics. Cell Metab. 2017; 25:262–84. https://doi.org/10.1016/j.cmet.2016.12.022 [PubMed]
- 8. Satapati S, Sunny NE, Kucejova B, Fu X, He TT, Méndez-Lucas A, Shelton JM, Perales JC, Browning JD, Burgess SC. Elevated TCA cycle function in the pathology of diet-induced hepatic insulin resistance and fatty liver. J Lipid Res. 2012; 53:1080–92. https://doi.org/10.1194/jlr.M023382 [PubMed]
- 9. Qiu P, Liu Y, Zhang J. Review: the Role and Mechanisms of Macrophage Autophagy in Sepsis. Inflammation. 2019; 42:6–19. https://doi.org/10.1007/s10753-018-0890-8 [PubMed]
- 10. Faix JD. Biomarkers of sepsis. Crit Rev Clin Lab Sci. 2013; 50:23–36. https://doi.org/10.3109/10408363.2013.764490 [PubMed]
- 11. Schappe MS, Szteyn K, Stremska ME, Mendu SK, Downs TK, Seegren PV, Mahoney MA, Dixit S, Krupa JK, Stipes EJ, Rogers JS, Adamson SE, Leitinger N, Desai BN. Chanzyme TRPM7 Mediates the Ca2+ Influx Essential for Lipopolysaccharide-Induced Toll-Like Receptor 4 Endocytosis and Macrophage Activation. Immunity. 2018; 48:59–74.e5. https://doi.org/10.1016/j.immuni.2017.11.026 [PubMed]
- 12. Orecchioni M, Ghosheh Y, Pramod AB, Ley K. Macrophage Polarization: Different Gene Signatures in M1(LPS+) vs. Classically and M2(LPS-) vs. Alternatively Activated Macrophages. Front Immunol. 2019; 10:1084. https://doi.org/10.3389/fimmu.2019.01084 [PubMed]
- 13. Hotchkiss RS, Moldawer LL, Opal SM, Reinhart K, Turnbull IR, Vincent JL. Sepsis and septic shock. Nat Rev Dis Primers. 2016; 2:16045. https://doi.org/10.1038/nrdp.2016.45 [PubMed]
- 14. Taratummarat S, Sangphech N, Vu CTB, Palaga T, Ondee T, Surawut S, Sereemaspun A, Ritprajak P, Leelahavanichkul A. Gold nanoparticles attenuates bacterial sepsis in cecal ligation and puncture mouse model through the induction of M2 macrophage polarization. BMC Microbiol. 2018; 18:85. https://doi.org/10.1186/s12866-018-1227-3 [PubMed]
- 15. Lampiasi N, Russo R, Zito F. The Alternative Faces of Macrophage Generate Osteoclasts. Biomed Res Int. 2016; 2016:9089610. https://doi.org/10.1155/2016/9089610 [PubMed]
- 16. Viola A, Munari F, Sánchez-Rodríguez R, Scolaro T, Castegna A. The Metabolic Signature of Macrophage Responses. Front Immunol. 2019; 10:1462. https://doi.org/10.3389/fimmu.2019.01462 [PubMed]
- 17. Bardi GT, Smith MA, Hood JL. Melanoma exosomes promote mixed M1 and M2 macrophage polarization. Cytokine. 2018; 105:63–72. https://doi.org/10.1016/j.cyto.2018.02.002 [PubMed]
- 18. Love MI, Huber W, Anders S. Moderated estimation of fold change and dispersion for RNA-seq data with DESeq2. Genome Biol. 2014; 15:550. https://doi.org/10.1186/s13059-014-0550-8 [PubMed]
- 19. Yu G, Wang LG, Han Y, He QY. clusterProfiler: an R package for comparing biological themes among gene clusters. OMICS. 2012; 16:284–7. https://doi.org/10.1089/omi.2011.0118 [PubMed]
- 20. Yunna C, Mengru H, Lei W, Weidong C. Macrophage M1/M2 polarization. Eur J Pharmacol. 2020; 877:173090. https://doi.org/10.1016/j.ejphar.2020.173090 [PubMed]
- 21. Vergadi E, Ieronymaki E, Lyroni K, Vaporidi K, Tsatsanis C. Akt Signaling Pathway in Macrophage Activation and M1/M2 Polarization. J Immunol. 2017; 198:1006–14. https://doi.org/10.4049/jimmunol.1601515 [PubMed]
- 22. Esposito S, De Simone G, Boccia G, De Caro F, Pagliano P. Sepsis and septic shock: New definitions, new diagnostic and therapeutic approaches. J Glob Antimicrob Resist. 2017; 10:204–12. https://doi.org/10.1016/j.jgar.2017.06.013 [PubMed]
- 23. Makic MBF, Bridges E. CE: Managing Sepsis and Septic Shock: Current Guidelines and Definitions. Am J Nurs. 2018; 118:34–9. https://doi.org/10.1097/01.NAJ.0000530223.33211.f5 [PubMed]
- 24. Seymour CW, Gesten F, Prescott HC, Friedrich ME, Iwashyna TJ, Phillips GS, Lemeshow S, Osborn T, Terry KM, Levy MM. Time to Treatment and Mortality during Mandated Emergency Care for Sepsis. N Engl J Med. 2017; 376:2235–44. https://doi.org/10.1056/NEJMoa1703058 [PubMed]
- 25. Hoover DB, Ozment TR, Wondergem R, Li C, Williams DL. Impaired heart rate regulation and depression of cardiac chronotropic and dromotropic function in polymicrobial sepsis. Shock. 2015; 43:185–91. https://doi.org/10.1097/SHK.0000000000000272 [PubMed]
- 26. Shiroorkar PN, Afzal O, Kazmi I, Al-Abbasi FA, Altamimi ASA, Gubbiyappa KS, Sreeharsha N. Cardioprotective Effect of Tangeretin by Inhibiting PTEN/AKT/mTOR Axis in Experimental Sepsis-Induced Myocardial Dysfunction. Molecules. 2020; 25:5622. https://doi.org/10.3390/molecules25235622 [PubMed]
- 27. Swedberg K, Young JB, Anand IS, Cheng S, Desai AS, Diaz R, Maggioni AP, McMurray JJ, O'Connor C, Pfeffer MA, Solomon SD, Sun Y, Tendera M, van Veldhuisen DJ, and RED-HF Committees, and RED-HF Investigators. Treatment of anemia with darbepoetin alfa in systolic heart failure. N Engl J Med. 2013; 368:1210–9. https://doi.org/10.1056/NEJMoa1214865 [PubMed]
- 28. Furian T, Aguiar C, Prado K, Ribeiro RV, Becker L, Martinelli N, Clausell N, Rohde LE, Biolo A. Ventricular dysfunction and dilation in severe sepsis and septic shock: relation to endothelial function and mortality. J Crit Care. 2012; 27:319.e9–15. https://doi.org/10.1016/j.jcrc.2011.06.017 [PubMed]
- 29. Lanspa MJ, Cirulis MM, Wiley BM, Olsen TD, Wilson EL, Beesley SJ, Brown SM, Hirshberg EL, Grissom CK. Right Ventricular Dysfunction in Early Sepsis and Septic Shock. Chest. 2021; 159:1055–63. https://doi.org/10.1016/j.chest.2020.09.274 [PubMed]
- 30. Pal N, Lim A, Karamchandani K. Sepsis-Induced Myocardial Dysfunction: "Right Ventricular Dysfunction" or "Biventricular Dysfunction"? Chest. 2021; 159:1684–5. https://doi.org/10.1016/j.chest.2020.11.054 [PubMed]
- 31. Cheng CW, Biton M, Haber AL, Gunduz N, Eng G, Gaynor LT, Tripathi S, Calibasi-Kocal G, Rickelt S, Butty VL, Moreno-Serrano M, Iqbal AM, Bauer-Rowe KE, et al. Ketone Body Signaling Mediates Intestinal Stem Cell Homeostasis and Adaptation to Diet. Cell. 2019; 178:1115–31.e15. https://doi.org/10.1016/j.cell.2019.07.048 [PubMed]
- 32. Fu SP, Li SN, Wang JF, Li Y, Xie SS, Xue WJ, Liu HM, Huang BX, Lv QK, Lei LC, Liu GW, Wang W, Liu JX. BHBA suppresses LPS-induced inflammation in BV-2 cells by inhibiting NF-κB activation. Mediators Inflamm. 2014; 2014:983401. https://doi.org/10.1155/2014/983401 [PubMed]
- 33. Saxton RA, Tsutsumi N, Su LL, Abhiraman GC, Mohan K, Henneberg LT, Aduri NG, Gati C, Garcia KC. Structure-based decoupling of the pro- and anti-inflammatory functions of interleukin-10. Science. 2021; 371:eabc8433. https://doi.org/10.1126/science.abc8433 [PubMed]
- 34. Park KS, Svennerholm K, Shelke GV, Bandeira E, Lässer C, Jang SC, Chandode R, Gribonika I, Lötvall J. Mesenchymal stromal cell-derived nanovesicles ameliorate bacterial outer membrane vesicle-induced sepsis via IL-10. Stem Cell Res Ther. 2019; 10:231. https://doi.org/10.1186/s13287-019-1352-4 [PubMed]
- 35. Jensen IJ, McGonagill PW, Butler NS, Harty JT, Griffith TS, Badovinac VP. NK Cell-Derived IL-10 Supports Host Survival during Sepsis. J Immunol. 2021; 206:1171–80. https://doi.org/10.4049/jimmunol.2001131 [PubMed]
- 36. Wu K, Lin K, Li X, Yuan X, Xu P, Ni P, Xu D. Redefining Tumor-Associated Macrophage Subpopulations and Functions in the Tumor Microenvironment. Front Immunol. 2020; 11:1731. https://doi.org/10.3389/fimmu.2020.01731 [PubMed]
- 37. Xu Y, Li Y, Liu X, Pan Y, Sun Z, Xue Y, Wang T, Dou H, Hou Y. SPIONs enhances IL-10-producing macrophages to relieve sepsis via Cav1-Notch1/HES1-mediated autophagy. Int J Nanomedicine. 2019; 14:6779–97. https://doi.org/10.2147/IJN.S215055 [PubMed]
- 38. Varol C, Mildner A, Jung S. Macrophages: development and tissue specialization. Annu Rev Immunol. 2015; 33:643–75. https://doi.org/10.1146/annurev-immunol-032414-112220 [PubMed]
- 39. Murray PJ. Macrophage Polarization. Annu Rev Physiol. 2017; 79:541–66. https://doi.org/10.1146/annurev-physiol-022516-034339 [PubMed]
- 40. Hamidzadeh K, Christensen SM, Dalby E, Chandrasekaran P, Mosser DM. Macrophages and the Recovery from Acute and Chronic Inflammation. Annu Rev Physiol. 2017; 79:567–92. https://doi.org/10.1146/annurev-physiol-022516-034348 [PubMed]
- 41. Guo S, Wang H, Yin Y. Microglia Polarization From M1 to M2 in Neurodegenerative Diseases. Front Aging Neurosci. 2022; 14:815347. https://doi.org/10.3389/fnagi.2022.815347 [PubMed]
- 42. Chen SW, Chou CT, Chang CC, Li YJ, Chen ST, Lin IC, Kok SH, Cheng SJ, Lee JJ, Wu TS, Kuo ML, Lin BR. HMGCS2 enhances invasion and metastasis via direct interaction with PPARα to activate Src signaling in colorectal cancer and oral cancer. Oncotarget. 2017; 8:22460–76. https://doi.org/10.18632/oncotarget.13006 [PubMed]
- 43. Asif S, Kim RY, Fatica T, Sim J, Zhao X, Oh Y, Denoncourt A, Cheung AC, Downey M, Mulvihill EE, Kim KH. Hmgcs2-mediated ketogenesis modulates high-fat diet-induced hepatosteatosis. Mol Metab. 2022; 61:101494. https://doi.org/10.1016/j.molmet.2022.101494 [PubMed]
- 44. d'Avignon DA, Puchalska P, Ercal B, Chang Y, Martin SE, Graham MJ, Patti GJ, Han X, Crawford PA. Hepatic ketogenic insufficiency reprograms hepatic glycogen metabolism and the lipidome. JCI Insight. 2018; 3:99762. https://doi.org/10.1172/jci.insight.99762 [PubMed]
- 45. Zhang L, Shi J, Du D, Niu N, Liu S, Yang X, Lu P, Shen X, Shi N, Yao L, Zhang R, Hu G, Lu G, et al. Ketogenesis acts as an endogenous protective programme to restrain inflammatory macrophage activation during acute pancreatitis. EBioMedicine. 2022; 78:103959. https://doi.org/10.1016/j.ebiom.2022.103959 [PubMed]