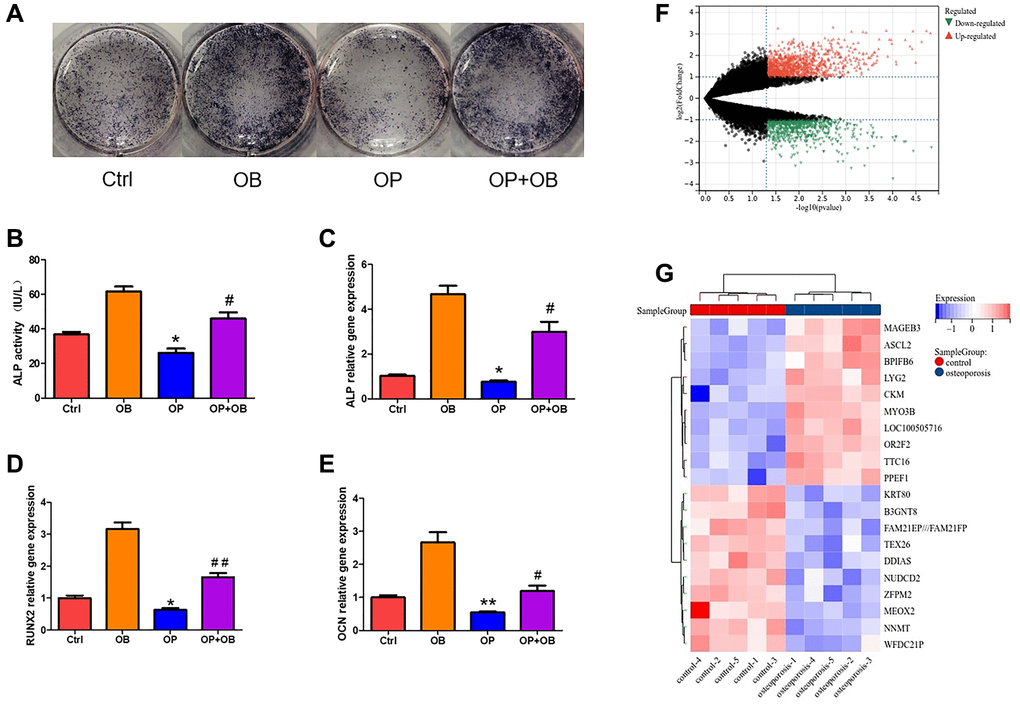
Figure 2.The difference of MSCs between osteoporosis and control. (A) ALP staining of osteogenic differentiation of MSCs from osteoporosis mice and control mice. (B) Quantitative analysis of ALP activity. (C–E) The gene expression of ALP, RUNX2 and OCN was detected by qRT-PCR after MSCs induced osteogenesis. (F) Volcanic map shows DEGs of MSCs in patients with osteoporosis and control. (G) Heat map shows the top twenty up-regulated and down-regulated DEGs. (Compared with Ctrl group, the statistically significant difference was *p < 0.05, **p < 0.01, and compared with OB group, it was #p < 0.05, ##p < 0.01, n = 3).