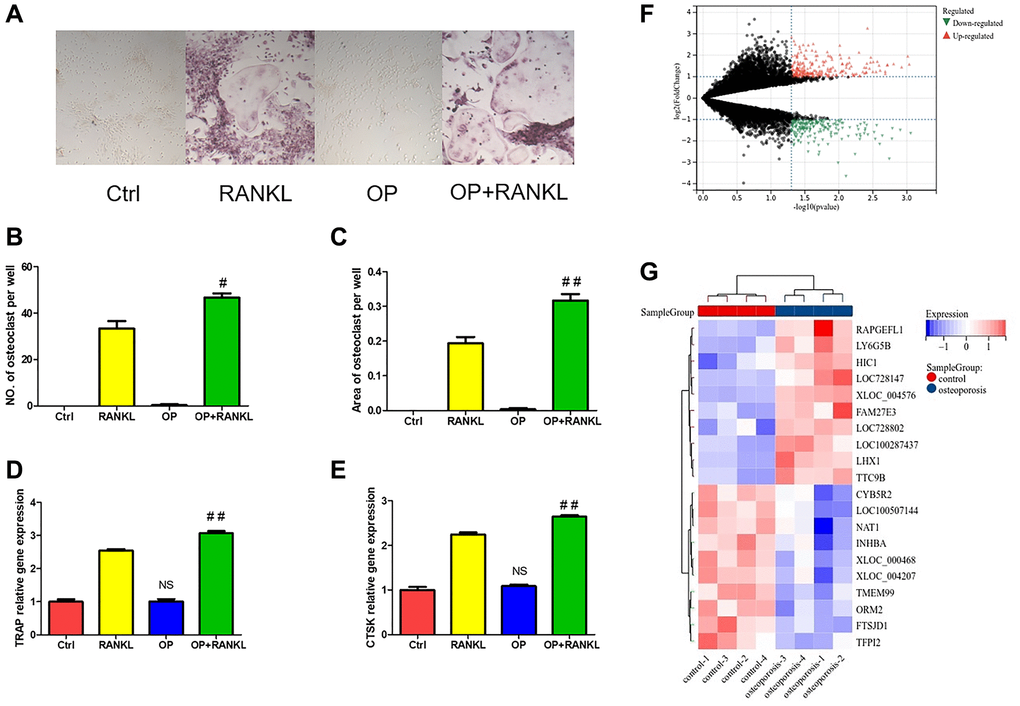
Figure 4.The difference of monocytes between osteoporosis and control. (A) TRAP staining of osteoclast differentiation of monocytes from osteoporosis mice and control mice. (B, C) Quantitative analysis of TRAP positive osteoclasts. (D, E) The gene expression of TRAP and CTSK was detected by qRT-PCR after monocytes induced osteoclast. (F) Volcanic map shows DEGs of monocytes in patients with osteoporosis and control. (G) Heat map shows the top twenty up-regulated and down-regulated DEGs. (NS means no significance compared with the Ctrl group, and compared with RANKL group, the statistically significant difference was #p < 0.05, ##p < 0.01, n = 3).