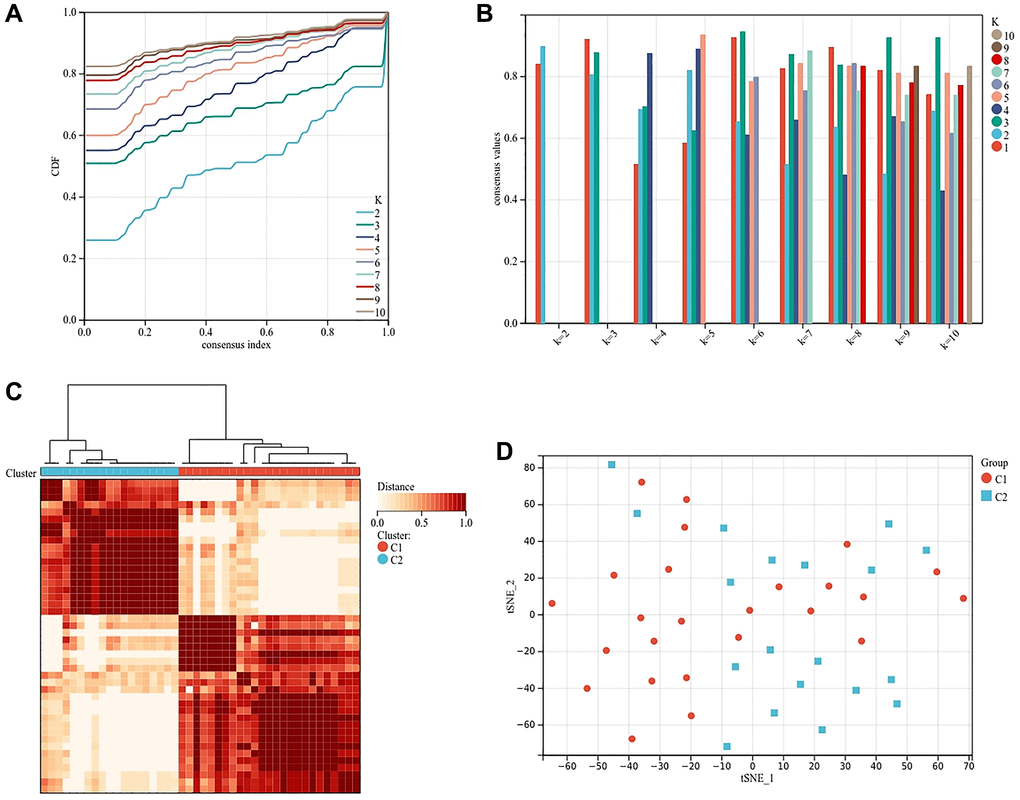
Figure 7.Cluster analysis based on the expression of genes related to osteogenesis inhibition and osteoclast promotion. (A) Clustering cumulative distribution function (CDF) curve. (B) Samples clustering consistency, determine k = 2. (C) Clustering Heatmap, cluster 1 (n = 25) and cluster 2 (n = 19). (D) tSNE diagram of two subtypes.