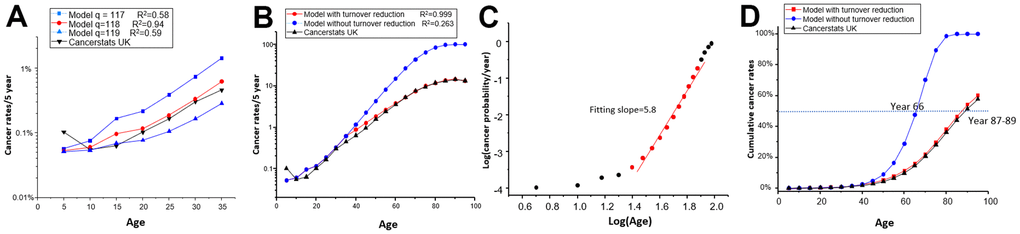
Figure 3.Comparison of model predicted data with real data of cancer incidence vs age. (A) The real data and predicted data were compared in the year group 0-35, considering different values of “q.” (B) The real data and predicted data were compared across all age groups using q=118, with or without considering cell turnover reduction. (C) The predicted data were plotted under log(probability) vs Log(age). Data points from age group 25 (20-25) to group 75 (70-75) (red dots) exhibit a linear trend with a slope of 5.8. (D) The real data and predicted data of cumulative cancer incidence were compared throughout the entire lifespan, with or without considering cell turnover reduction.