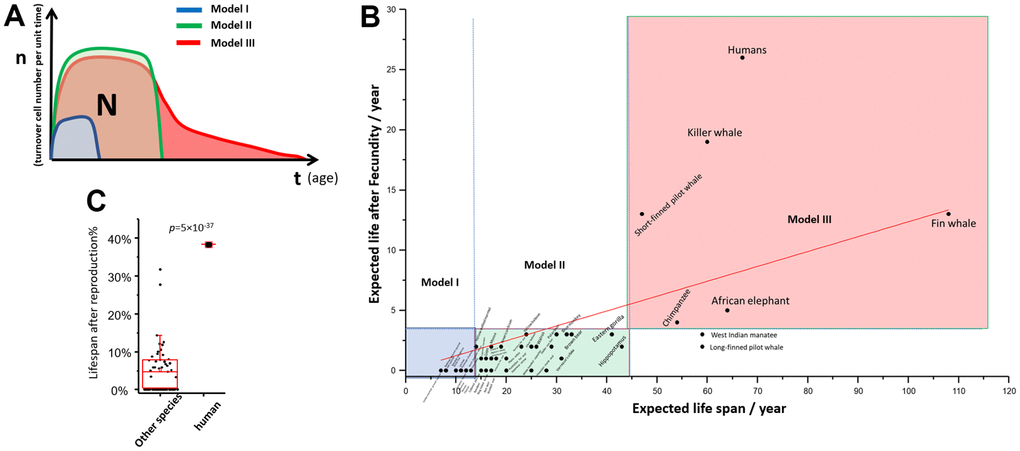
Figure 4.“np” theory of aging among different species. (A) Theoretical “nt” plot of model I, II, III species; (B) Post reproduction life vs expected life span of 51 mammal species; (C) The percentage of post reproduction life to whole life: human against the other mammals. T test was used to calculate statistical significance.