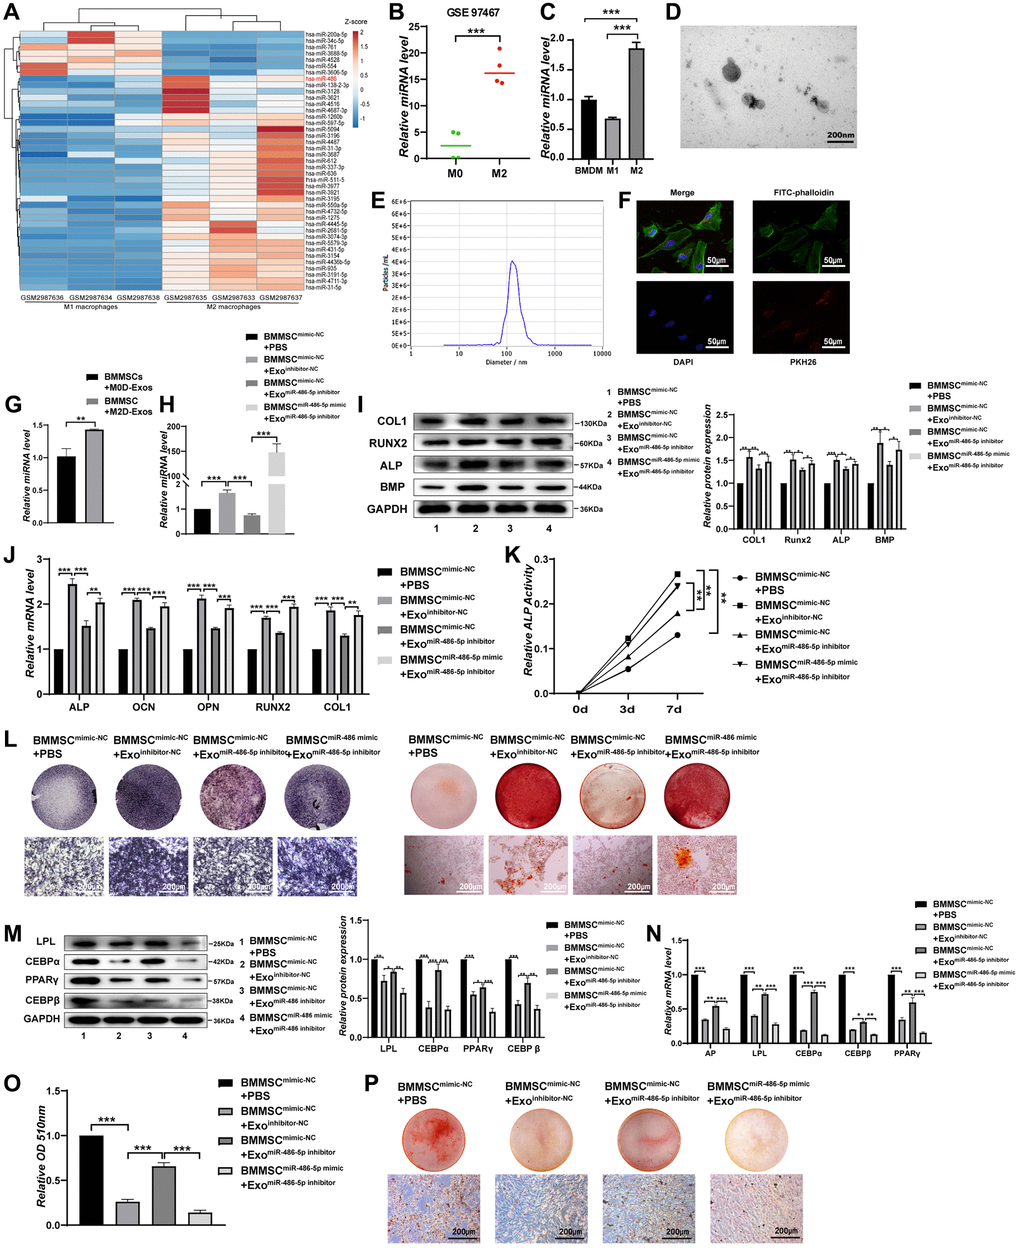
Figure 1.M2 macrophage-derived exosomal miRNA-486-5p promotes the osteogenic differentiation and inhibits the adipogenic differentiation of BMMSCs. (A) A heatmap identified the differently expressed miRNAs between M2 macrophages and M1 macrophages using GSE 110339 from the Gene Expression Omnibus (GEO) dataset (fold change > 1 or < − 1, Benjamini-Hochberg-corrected p). (B) Expression of the differentially expressed miR-486-5p between M2 macrophages-derived exosomes (M2D-Exos) and monocyte-derived exosomes using GSE97467 from the GEO dataset. (C) The miR-486-5p levels in bone marrow-derived macrophages (BMDMs), M1 macrophages, and M2 macrophages were measured by qRT-PCR analysis. (D) The morphology of M2D-Exos was shown by transmission electron microscopy (TEM). Scale bars, 200 nm. (E) The particle size distribution in purified M2D-Exos determined by nanoparticle tracking analysis (NTA). (F) Laser scanning confocal microscopy analysis of the internalization of PKH26-labelled M2D-Exos by BMMSCs, Scale bars, 50 μm. (G) Overexpression of miR-486-5p was detected in the BMMSCs treated with M2D-Exos by qRT-PCR analysis. (H) qRT-PCR analysis was used following the addition of PBS, M2D-Exosinhibitor-NC (exosomes from M2 macrophages transfected with the NC inhibitor) or M2D-ExosmiR-486-5p inhibitor (exosomes from M2 macrophages transfected with the miR-486-5p inhibitor) to assess miR-486-5p expression in the mimic NC- or miR-486-5p-transfected BMMSCs. (I, J) The expression of osteogenic differentiation proteins and mRNAs were assessed by Western blot and qRT-PCR. (K) An ALP activity assay was performed to analyse ALP activity on days 0, 3, and 7. (L) Alizarin red staining of BMMSCs after different transfections for 21 days. Alkaline phosphatase staining of BMMSCs following different treatments for 14 days. Scale bars, 200 μm. (M) Western blot analysis was used to assess the expression of adipogenic differentiation proteins, including LPL, CEBPα, PPARγ, and CEBPβ. (N) qRT-PCR analysis of AP, LPL, CEBPα, CEBPβ, and PPARγ gene levels; (O, P) Oil red O staining and extraction were performed to detect lipid droplet formation on day 10 of adipogenic differentiation. Scale bars, 200 μm. Data are expressed as the mean ± SEM, *p < 0.05, **p < 0.01, ***p < 0.005.