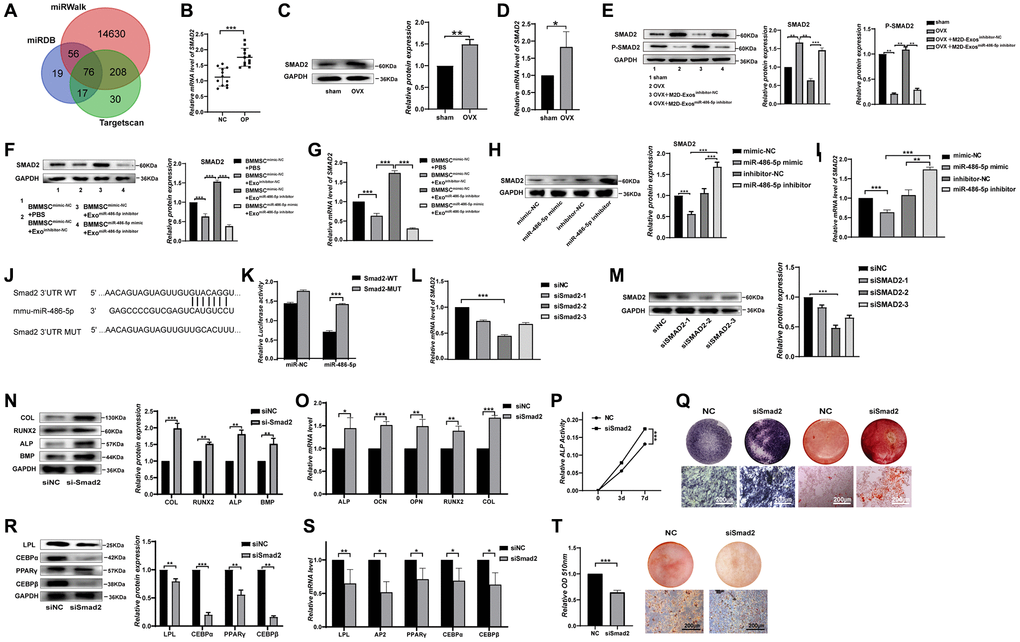
Figure 4.SMAD2 was the target of miR-486-5p. (A) TargetScan, miRDB, and miRWalk were used to predict gene targets of miR-486-5p. (B) mRNAs were extracted from bone specimens collected from female patients with osteoporosis (OP) and female subjects without osteoporosis (NC). SMAD2 mRNA expression was measured by qRT-PCR. (C, D) The expression of SMAD2 in bone tissues of OVX mice with osteoporosis and sham-operated control counterparts was measured by Western blots and qRT-PCR. (E) Western blot analysis was used to detect the expression of SMAD2 and p-SMAD2 in sham, OVX+PBS, OVX+M2D-Exosinhibitor-NC, and OVX+M2D-ExosmiR-486-5p inhibitor mice. (F, G) Western blots and qRT-PCR analysis were used following treatment with PBS, M2D-Exosinhibitor-NC, or M2D-ExosmiR-486-5p inhibitor to assess SMAD2 expression in mimic NC- or miR-486-5p-transfected BMMSCs. (H, I) Western blot and qRT-PCR analysis of SMAD2 levels in BMMSCs after treatment with mimic-NC, miR-486-5p mimic, inhibitor-NC, or miR-486-5p inhibitor for 48 h. (J) Schematic illustration of the design of luciferase reporters containing the WT SMAD2 3′UTR or the site-directed mutant SMAD2 3′UTR. (K) The wild-type (WT) or mutant-type (MUT) constructs were inserted into the psiCHECK-2 reporter vector. Luciferase activity was measured in the lysates, and the values were normalized to that of the psiCHECK-2 vector. (L, M) The knockdown efficiency of three SMAD2 siRNAs was confirmed by qRT-PCR and Western blot analysis. (N, O) Western blots and qRT-PCR were used to analyse osteogenic-specific markers after SMAD2 knockdown. (P) An ALP activity assay was performed to analyse ALP activity on days 0, 3, and 7. (Q) ALP staining was performed on day 14, and Alizarin red staining showed increased calcification on day 21 after SMAD2 knockdown. Scale bars, 200 μm. (R, S) Western blots and qRT-PCR were used to analyse adipogenic-specific markers after SMAD2 knockdown. (T) Oil red O staining and extraction were performed to detect the formation of lipid droplets on day 10 of adipogenic differentiation. Scale bars, 200 μm. Data are expressed as the mean ± SEM, *p < 0.05, **p < 0.01, ***p < 0.005.