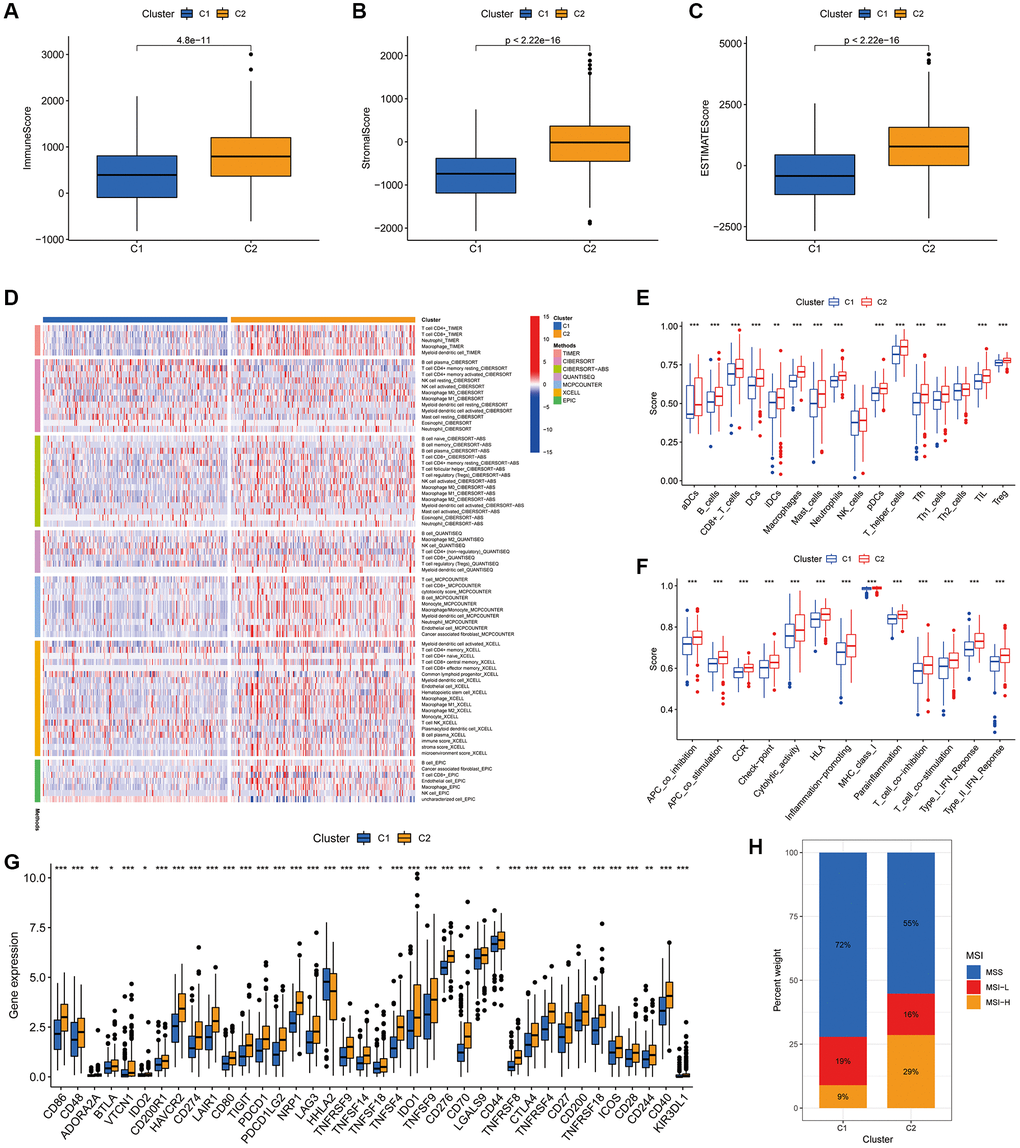
Figure 10.Association of the two clusters with the TIME. (A–C) Immune, stromal and ESTIMATE scores in the two clusters. (D) Heat map of the proportion of different types of immune cells. (E) Box plot showing differences in immune cells between the two clusters using the ssGSEA algorithm. (F) Box plot showing differences in immune-related functions between the two clusters using the ssGSEA algorithm. (G) Expression of immune checkpoint markers in the two clusters. (H) Histogram of proportions showing the proportion of patients with MSS, MSI-L and MSI-H in the two clusters. *P < 0.05, **P < 0.01 and ***P < 0.001.