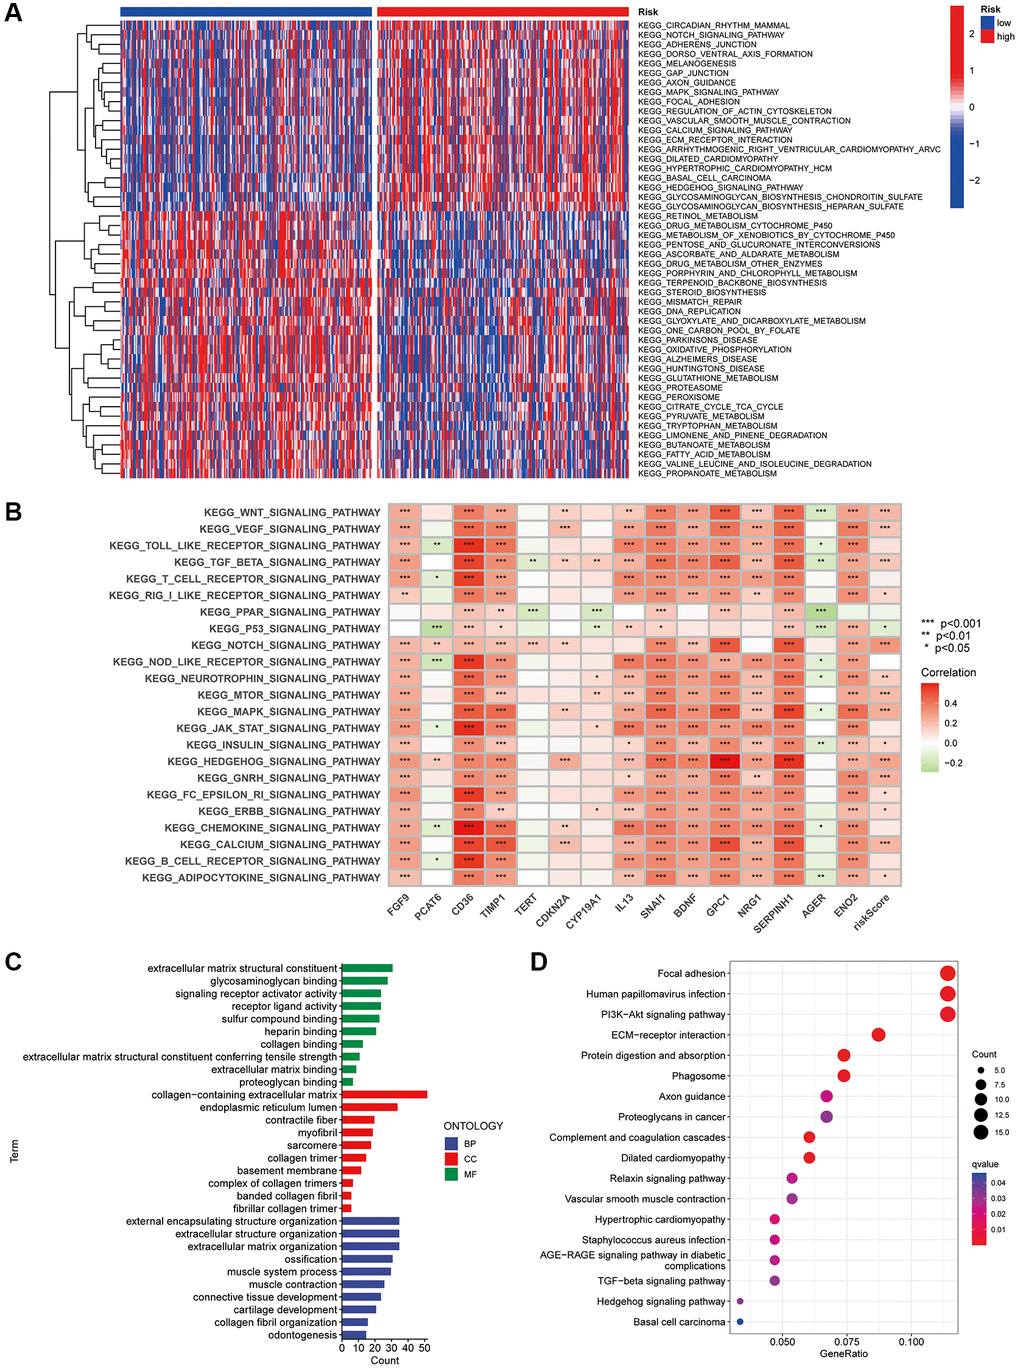
Figure 8.GSVA and GO analysis. (A) Heat map of functional pathway enrichment differences between the two risk groups. (B) Heat map of the correlation between the expression of signature genes and signalling pathways. (C) GO analysis shows the enrichment of DEGs between the high- and low-risk subgroups. (D) KEGG analysis shows the enrichment of DEGs between the two risk subgroups.