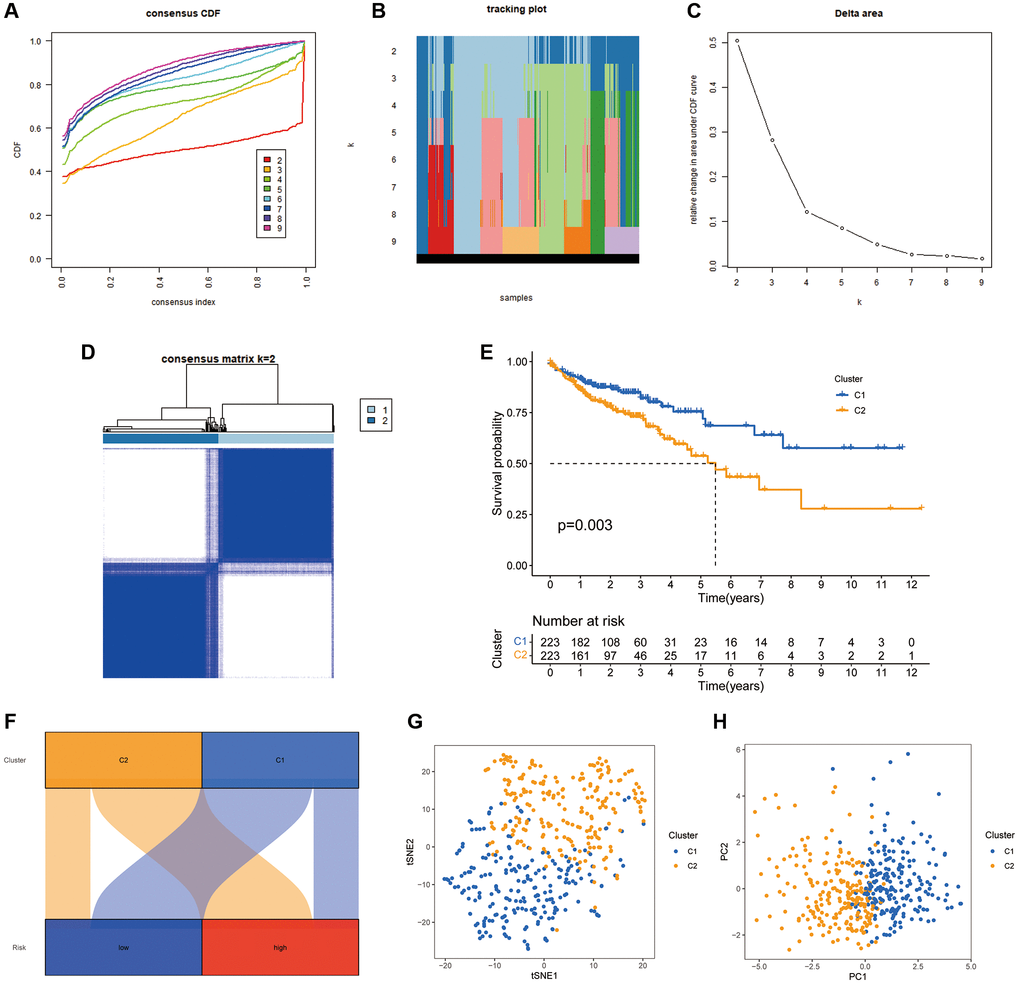
Figure 9.COAD classification based on the CRFRs. (A) The cumulative distribution function curves for k = 2–9. (B) The tracking plot of consistent clustering. (C) The elbow plot showing relative change in area under the cumulative distribution function curve. (D) Consensus clustering matrix for k = 2. (E) K–M curves of the two clusters. (F) Sankey diagram of the association between the risk groups and clusters. (G, H) PCA and tSNE analyses of the clusters.